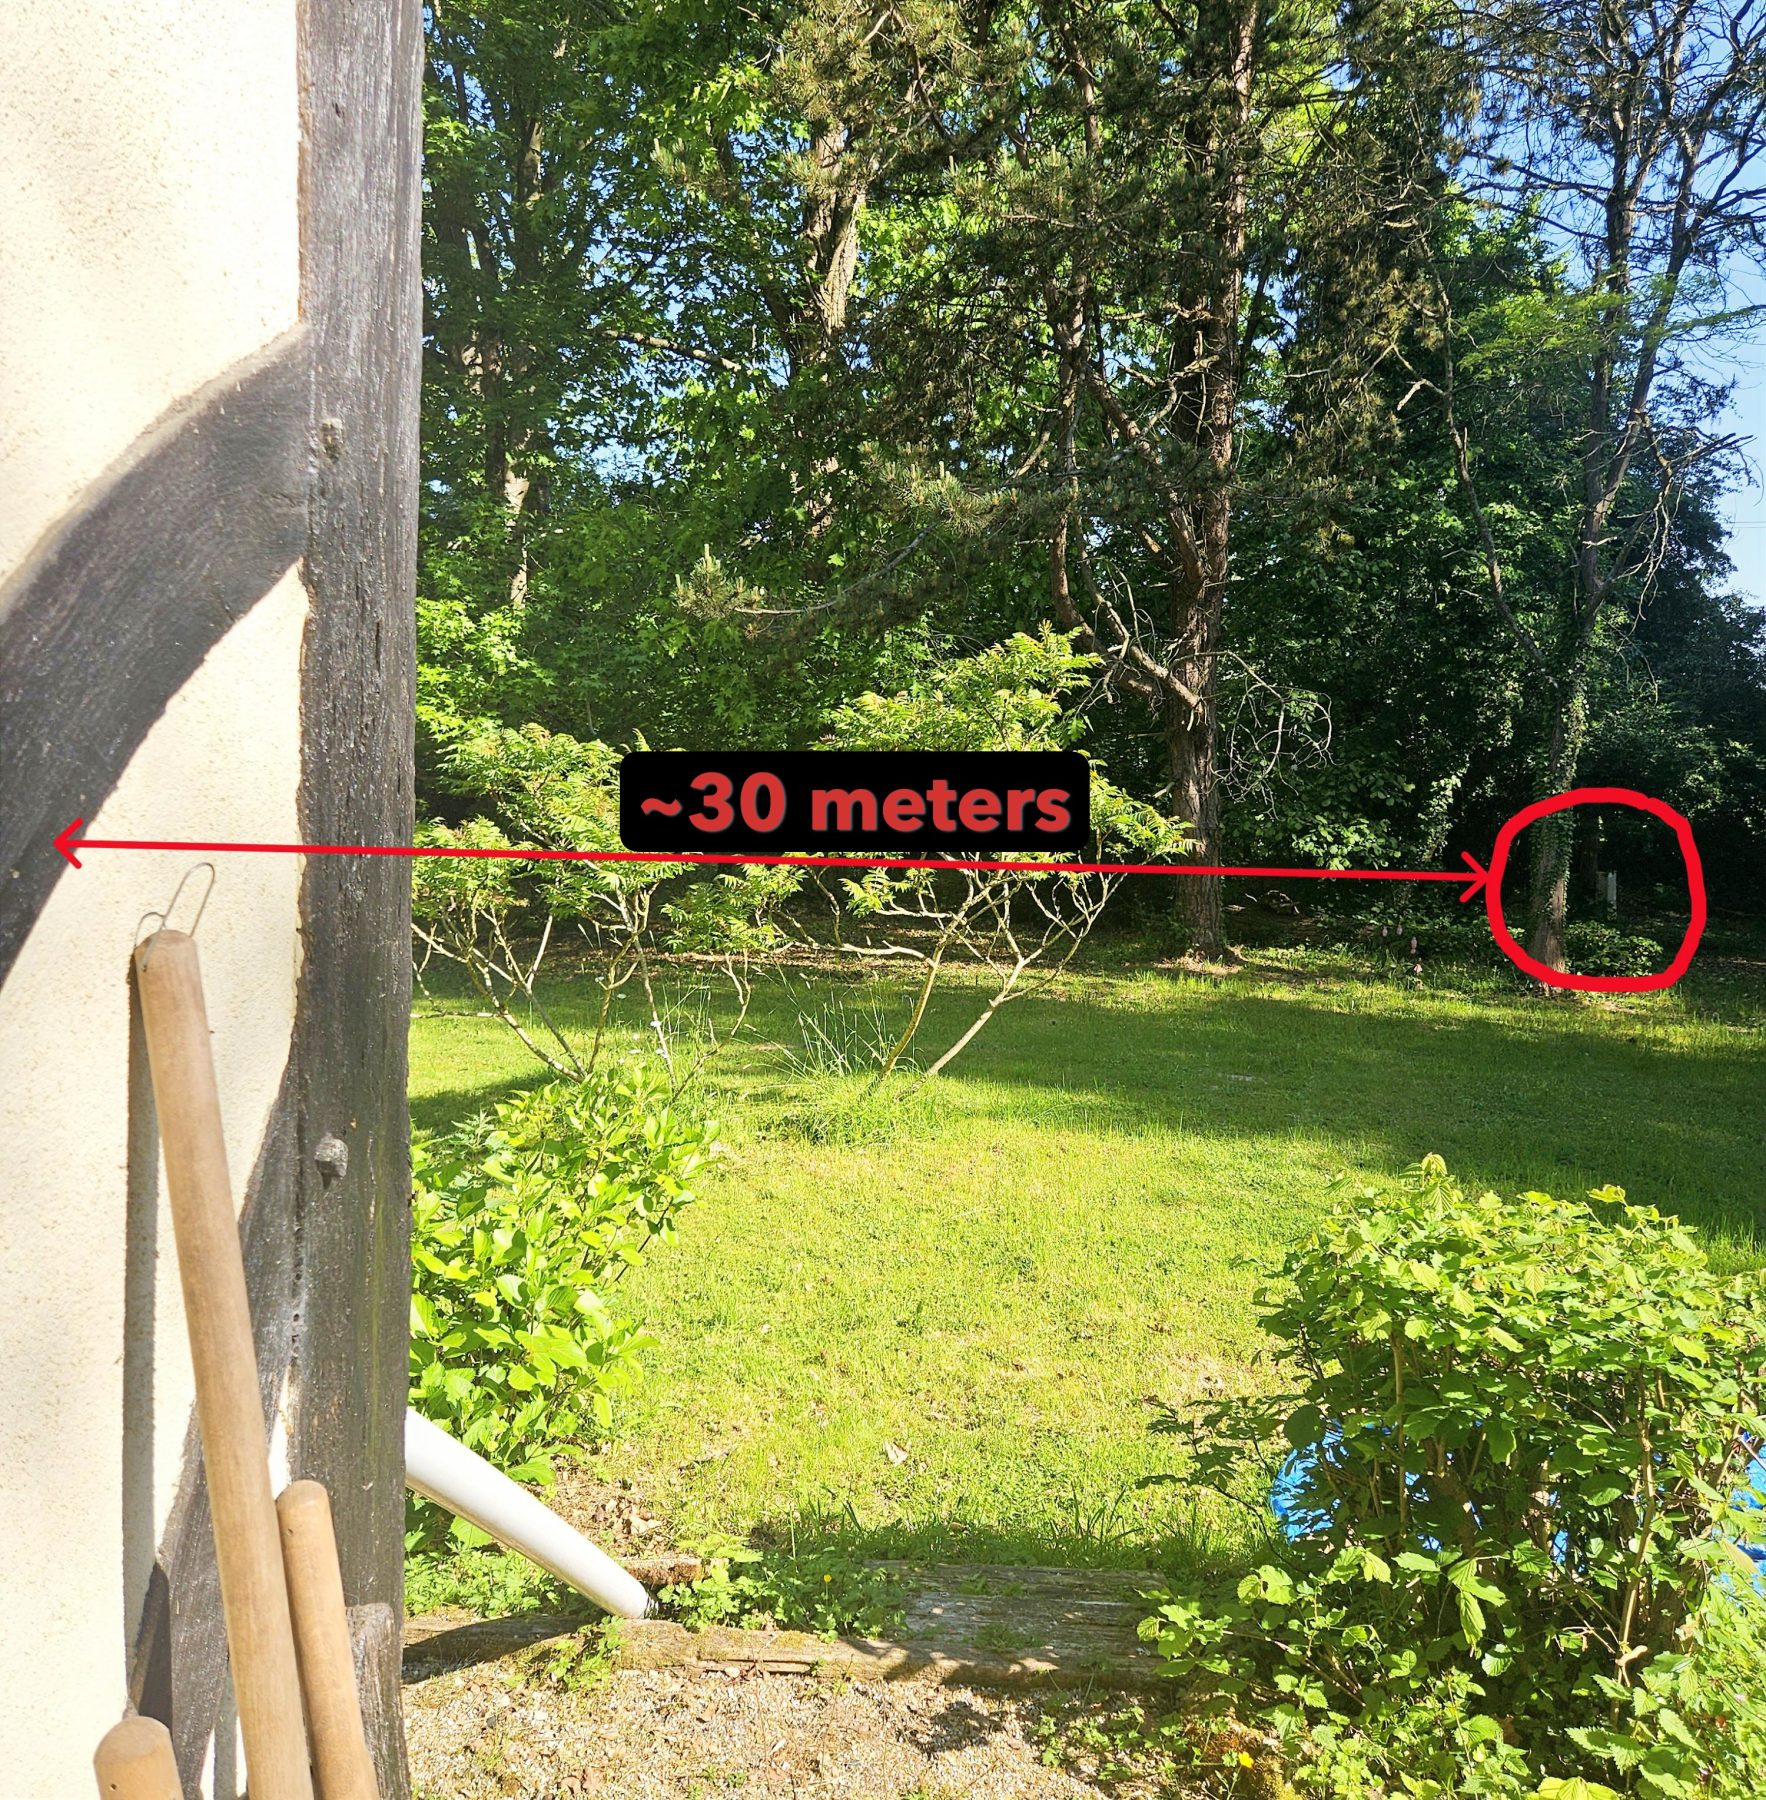
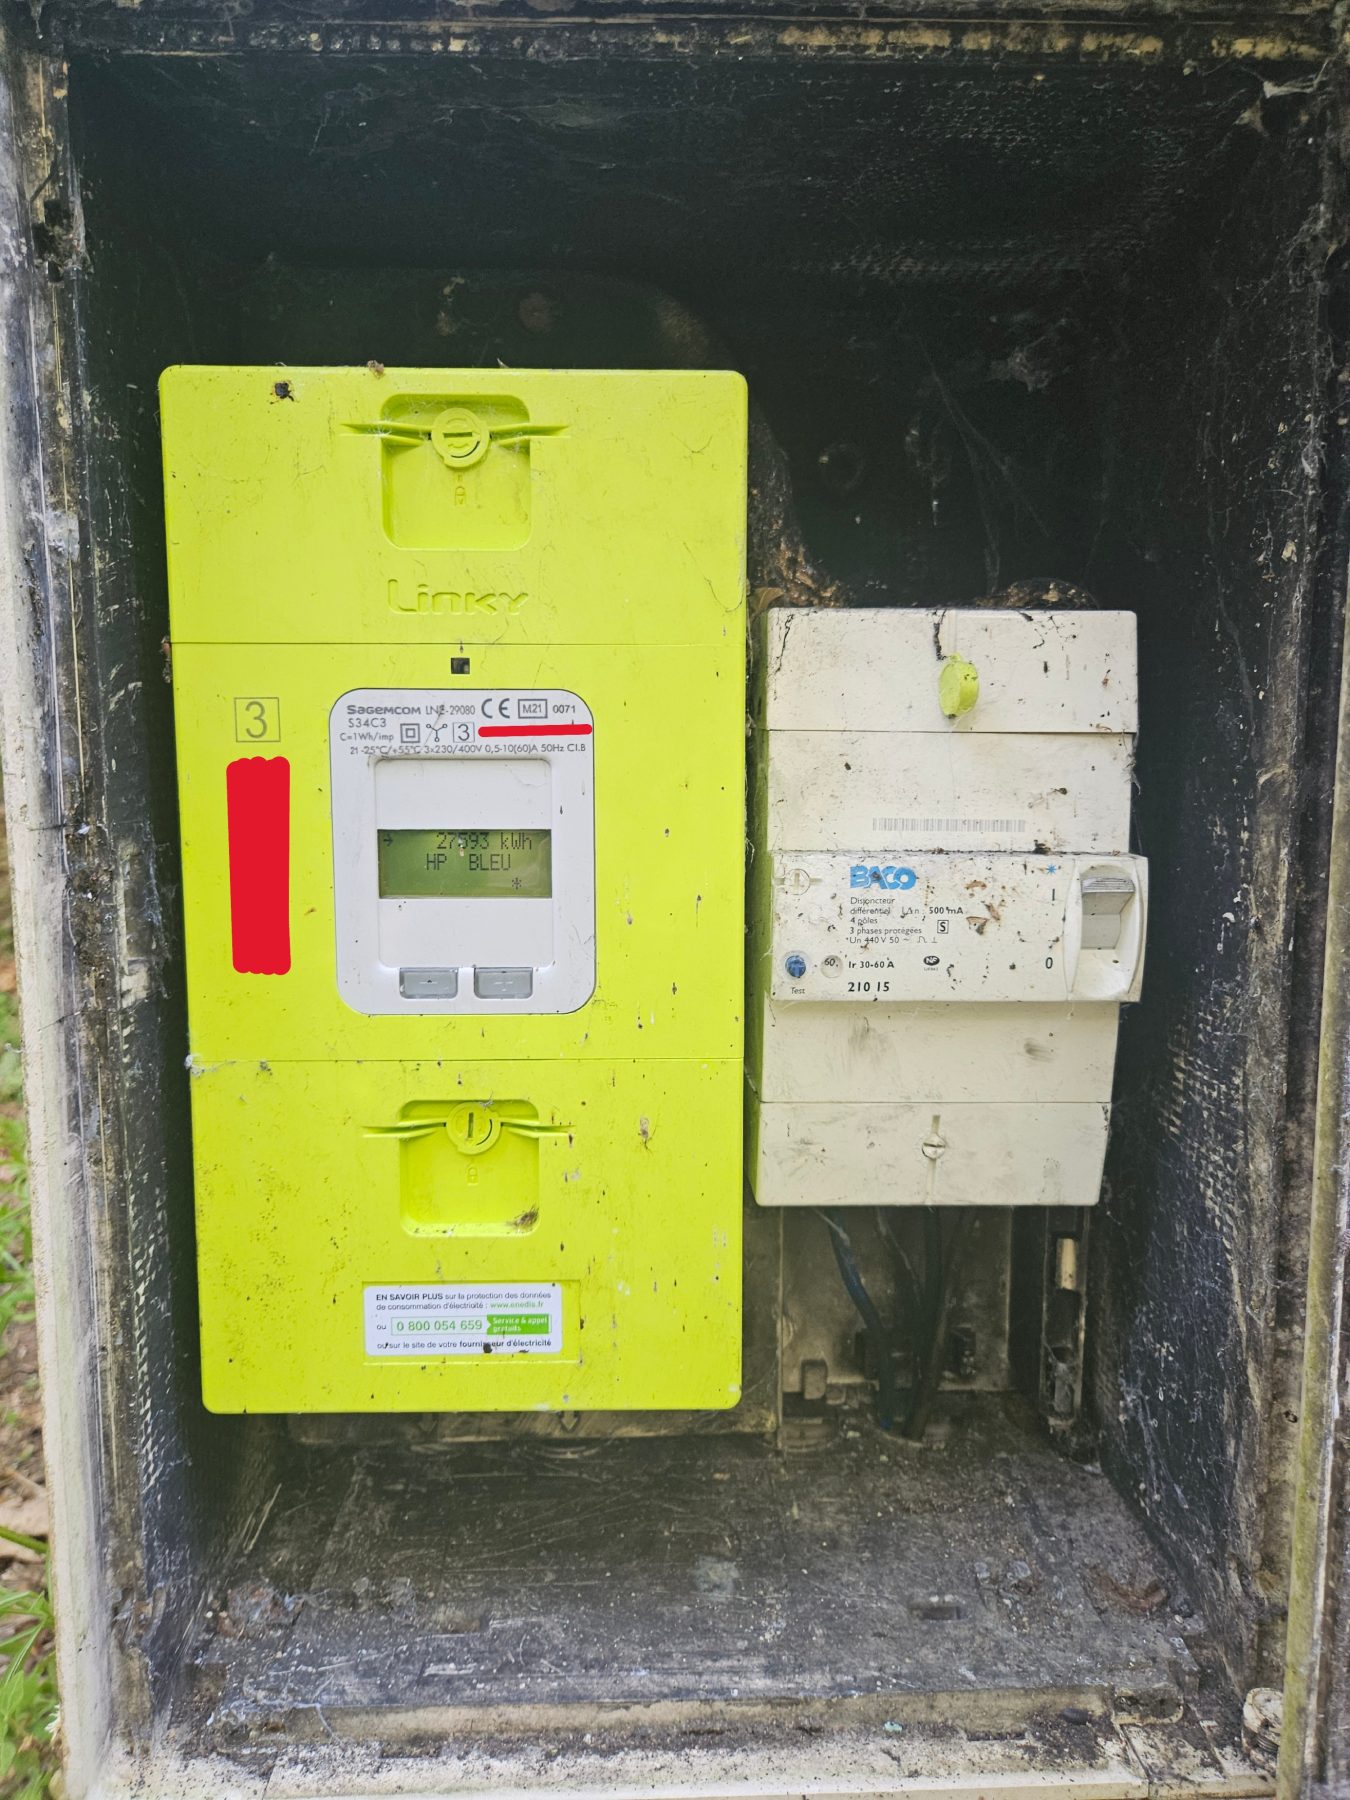
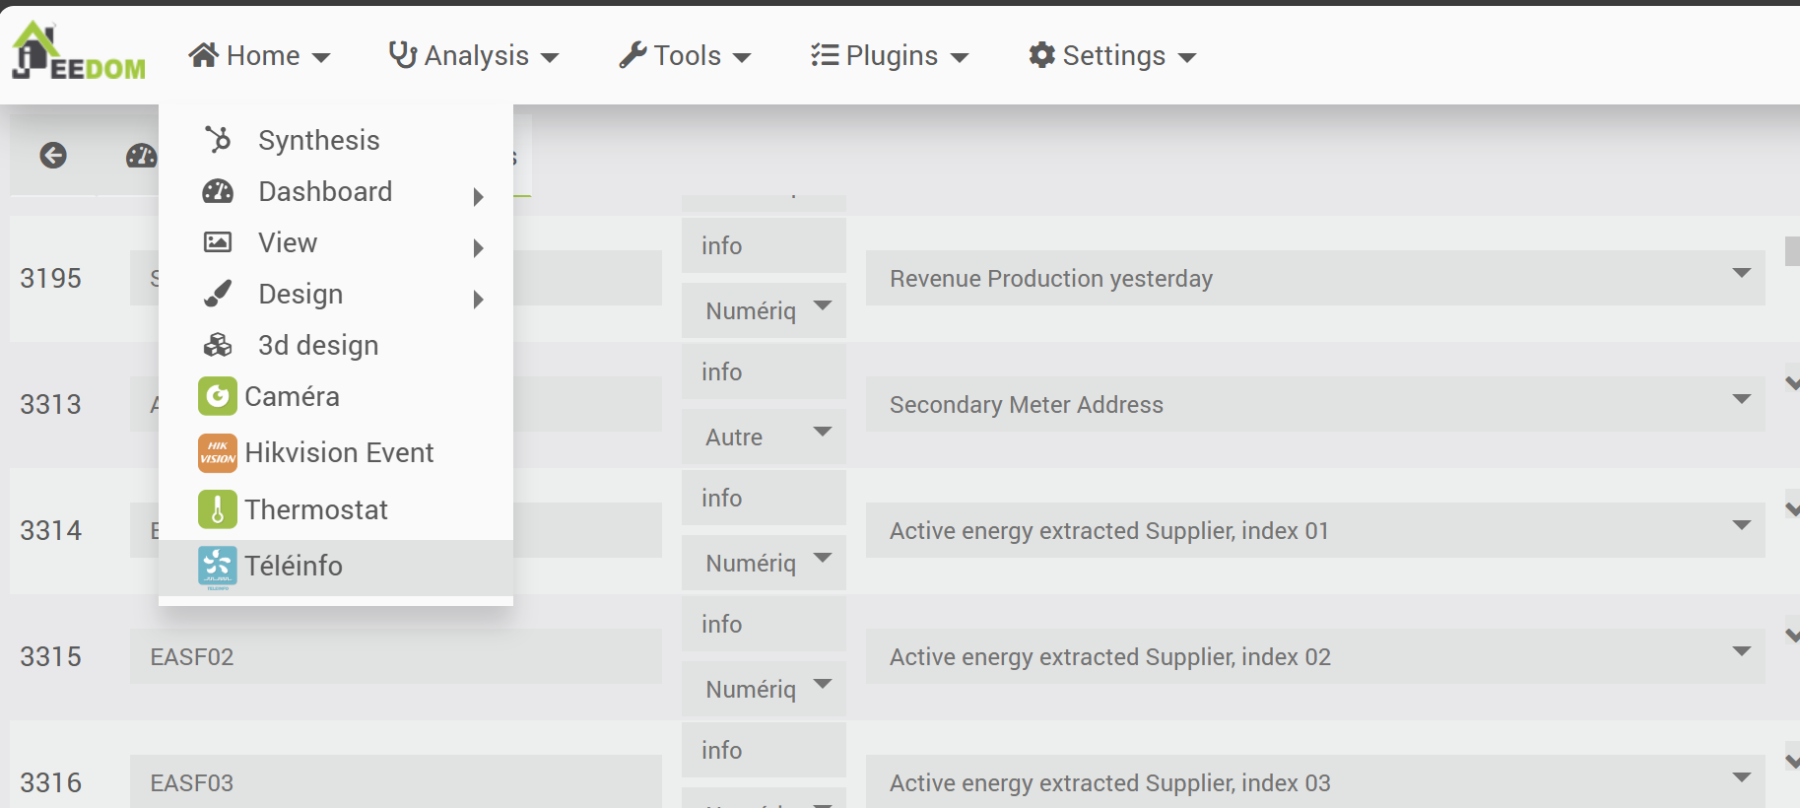
We have previously connected a Linky meter to a Jeedom home automation system via a Teleinfo/TIC USB over IP modem. This was in an apartment with a Wi-Fi network that was easily accessible from every room. We now want to send information from the Linky meter in another residence, the particularity here being that the meter is located in an electrical cabinet about 30 meters away (outdoors, with abundant vegetation) from the Jeedom home automation box, which is located inside thick walls in the house. All this without any possibility of running cables and without a power supply in the outdoor cabinet!
1. Objectives & constraints
The aim is to obtain a more accurate and responsive measurement capability than that provided by the EDF or ENEDIS interface, which is not updated in real time (at best every 30 minutes), to be able to measure the consumption of each phase of this three-phases electrical installation, to check for any imbalances between the power demanded on each phase, to be able to trigger scenarios based on events (e.g., load shedding), etc.
The difficulties are therefore:
- Not being able to easily use a wired connection
- Prevents the use of a “traditional” Teleinfo modem such as the one used in a previous article (unless a trench is dug).
- Not having a power supply in the outdoor cabinet where the main circuit breaker and the Linky meter are located.
- This currently prevents the use of a Raspberry system in the cabinet, which would serve as a relay as in our previous article, assuming that a reliable WiFi connection to the house can be established (or a wired connection if a trench is dug).
- Note for later: it’s still paradoxical in an electrical cabinet! We’ll clearly have to redo this cabinet and add one or two external outlets protected by small circuit breakers.
- The absence on the market of ZWave Teleinfo modules (which would also need to be self-powered by the Teleinfo port of the Linky meter)
- Distance, vegetation, and inclement weather
- Can affect any wireless technology
With regard to the wired connection (point 1), the idea of a trench has been ruled out for the time being. Furthermore, there is a self-powered Teleinfo Zigbee module on the market (which addresses points 2 and 3). However, this reaches the theoretical operating distance of Zigbee (point 4 to be verified) …
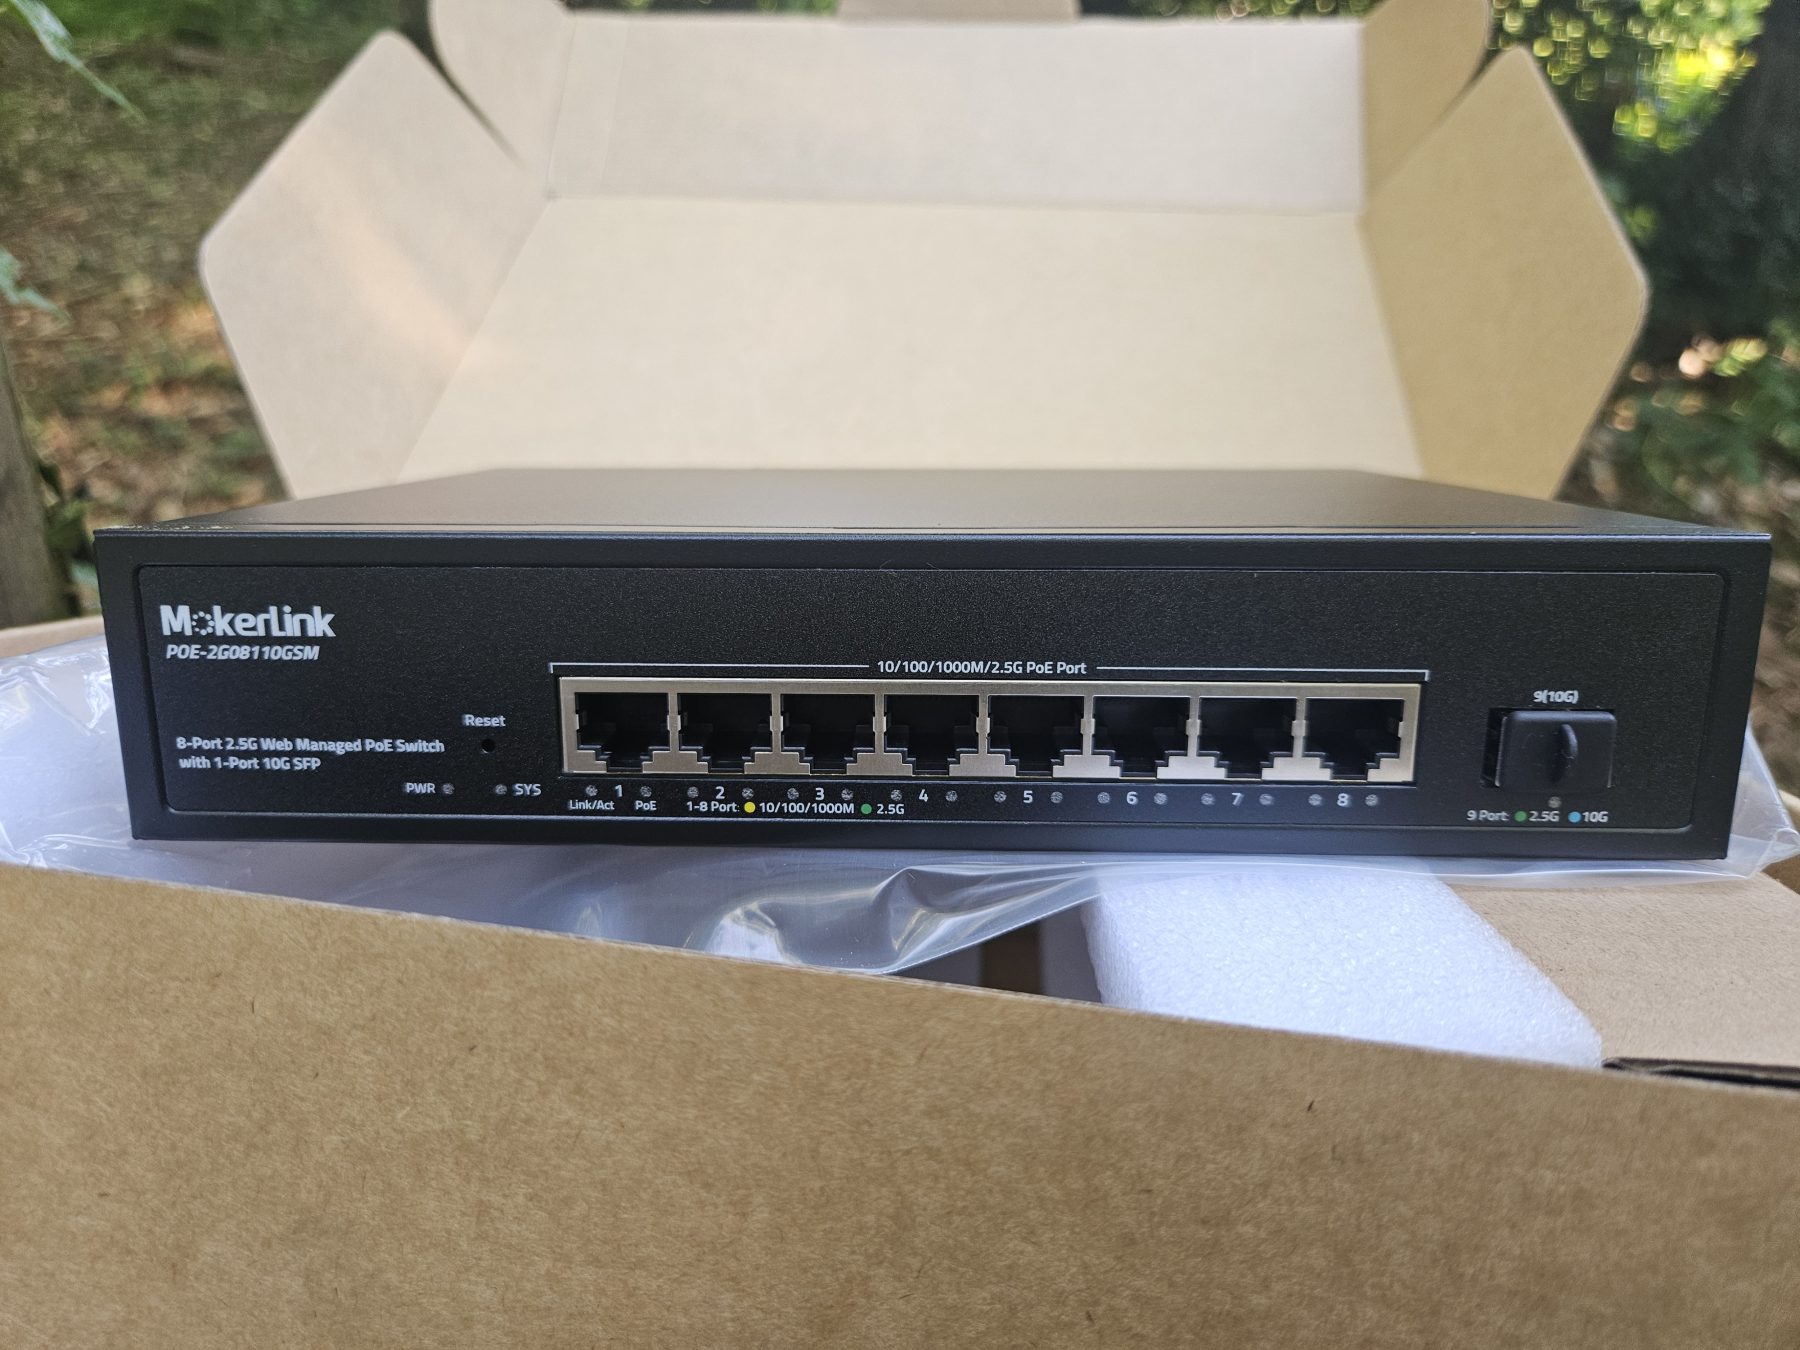
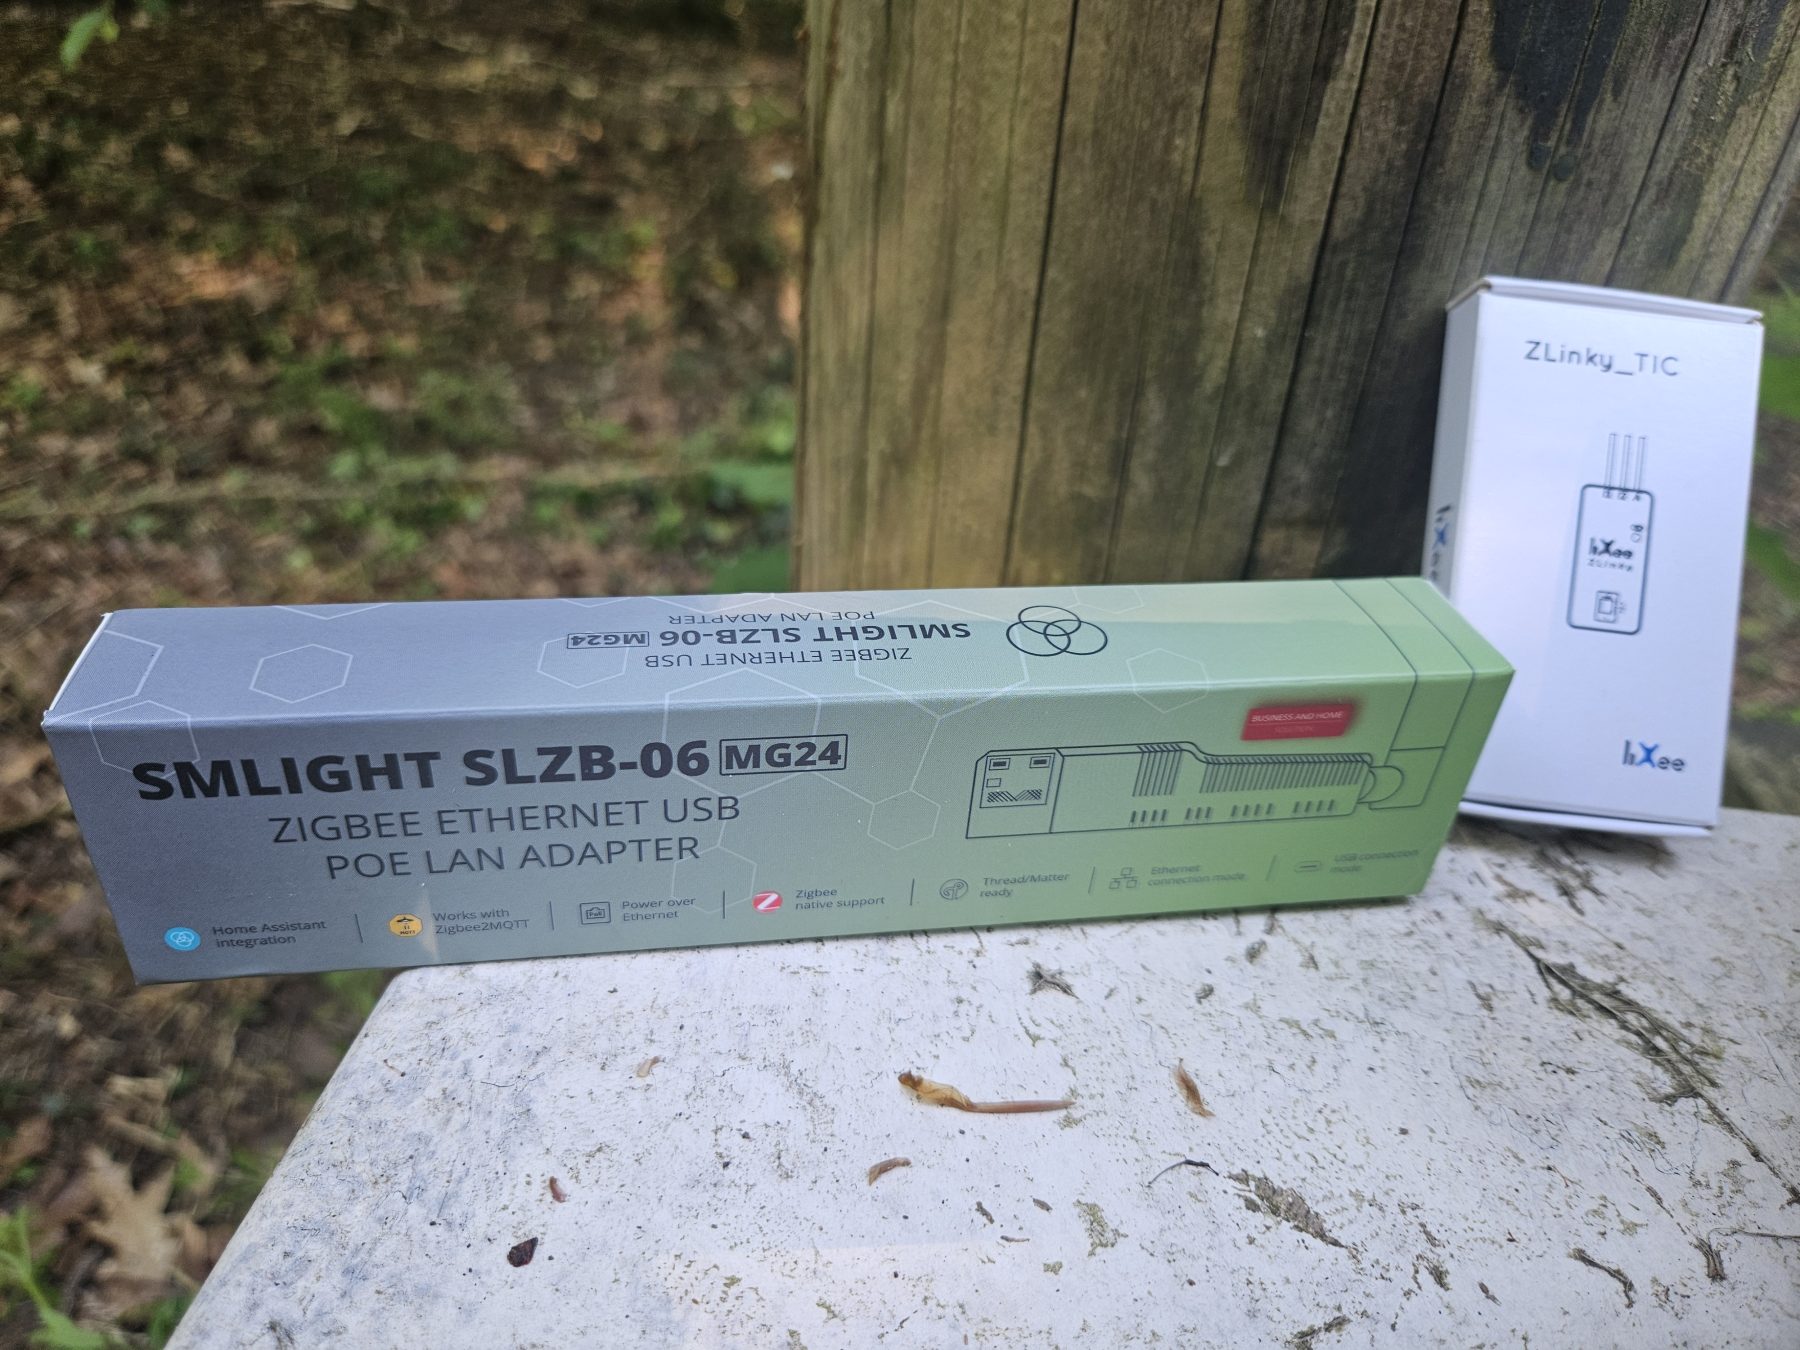
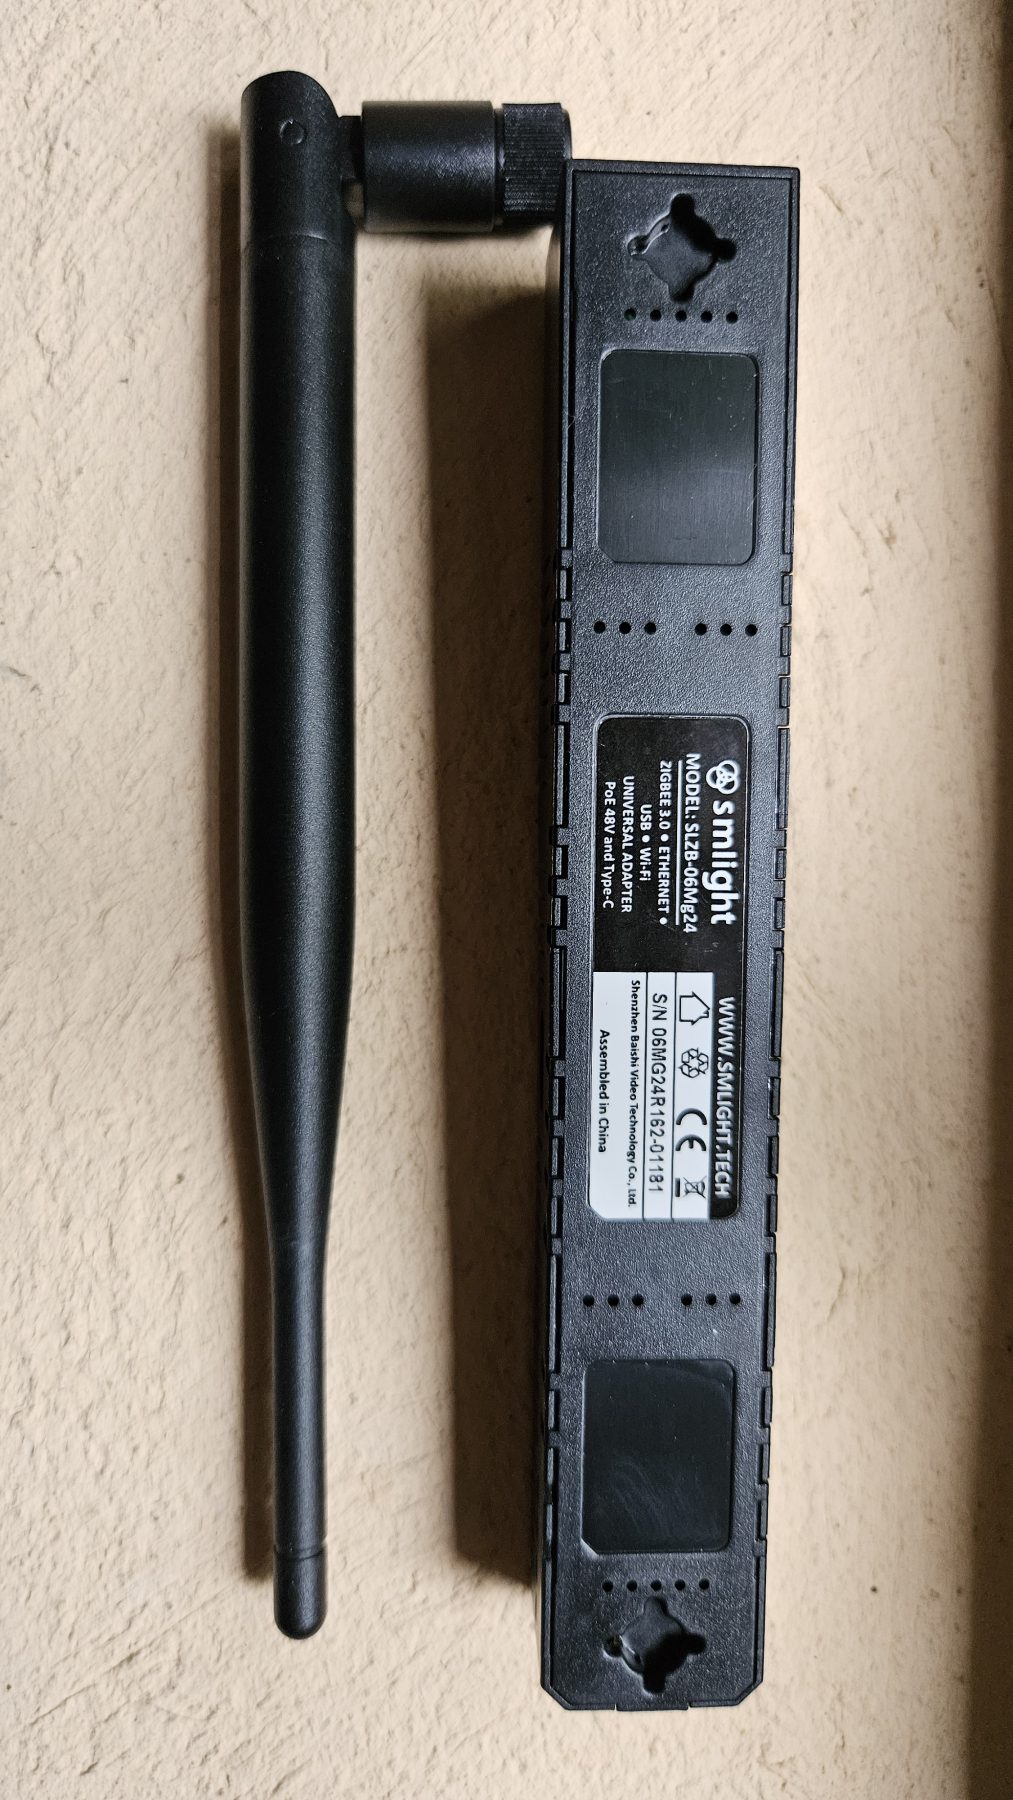
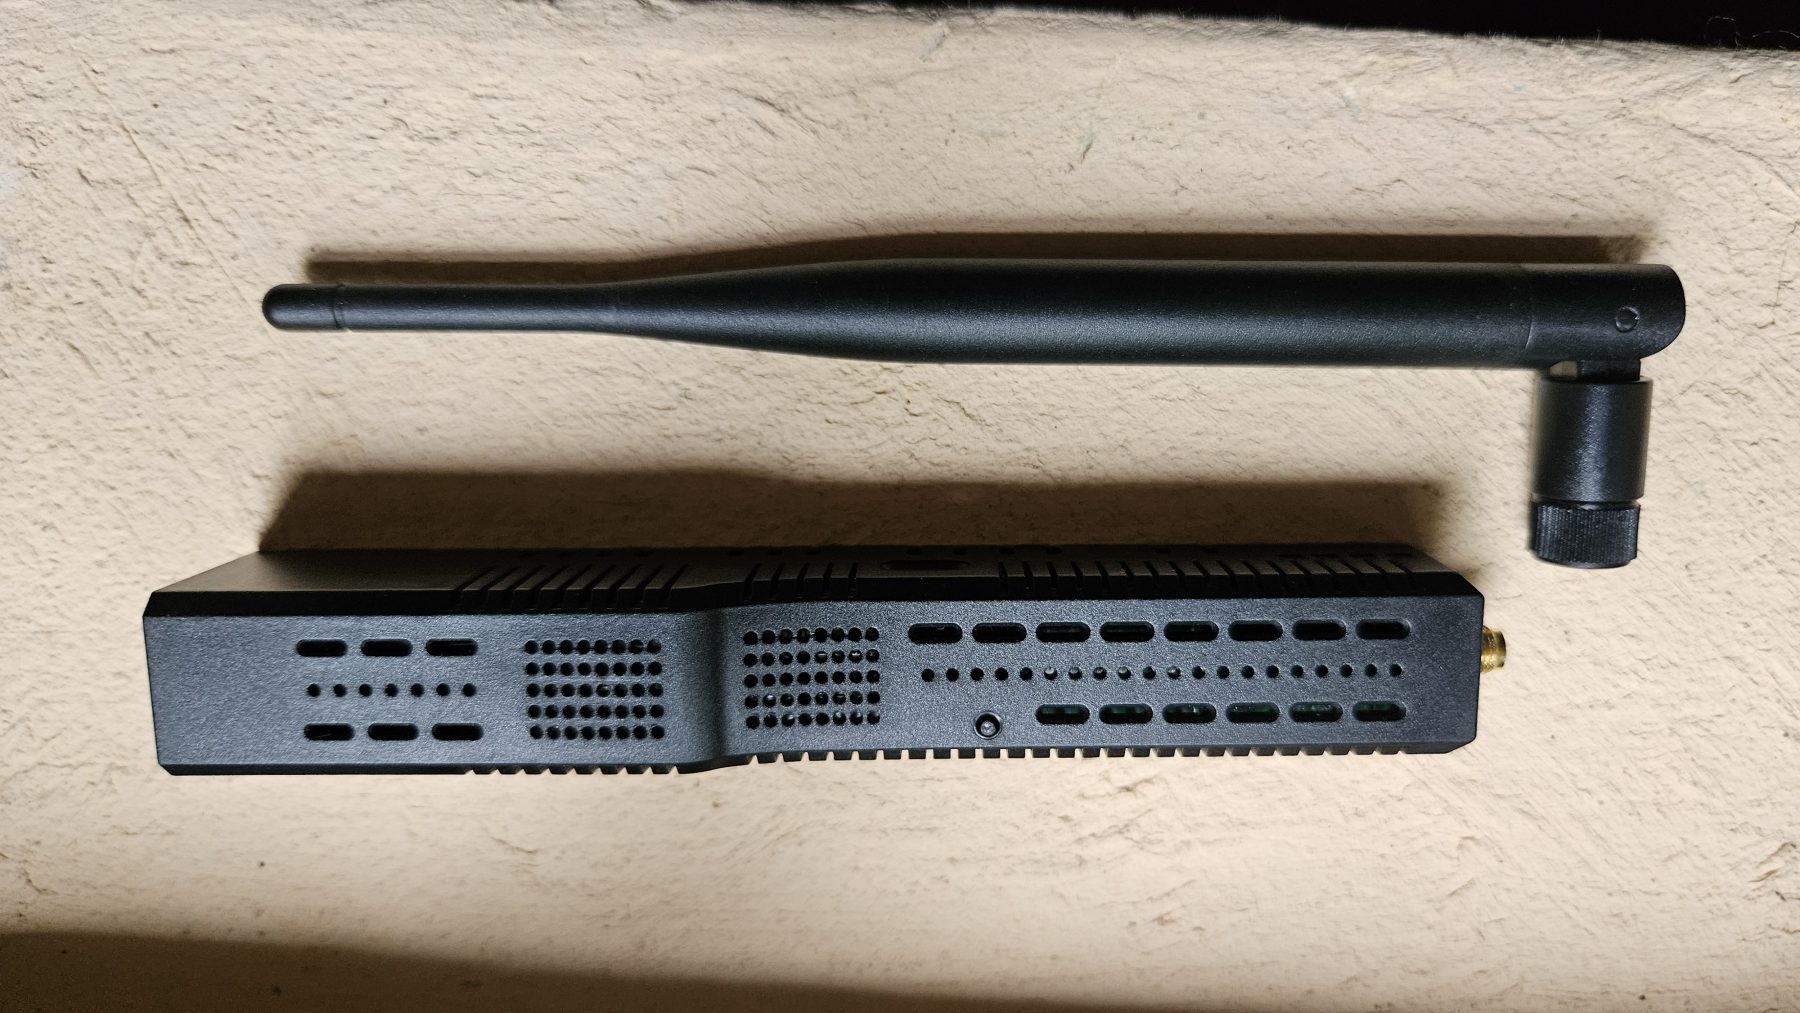
We will therefore attempt to add support for the Zigbee wireless protocol to the Jeedom home automation hub in this residence, using an SMLIGHT SLZB-06M Zigbee controller powered by POE switch to which we will add an additional SMA cable to relocate the antenna outside the building. On the remote electricity meter, we will use a Lixee ZLinky module, also with an external antenna.
2. Equipment
The list of equipment is specified above. However, here are a few details in photos.
As long as everything works as expected (keep in mind that we’re really pushing the theoretical distance limits of Zigbee here), this setup should let us get a Zigbee device into Jeedom—which we’ll call “Electric Meter”.
Once added, this virtual device will provide several information-type commands that let us display some basic data right in Jeedom.
And just like in my previous tutorial, we’ll also use this data to power a specialized plugin designed to log and visualize electricity consumption (Teleinfo plugin, which is free to use).
3. How a Zigbee network works
Because I have always equipped my home automation systems with ZWave hardware, which I find reliable, I needed to do some research on Zigbee. I thought it would be useful to write a summary here.
Zigbee is a wireless communication protocol designed for home automation and the Internet of Things (IoT). It allows objects to be connected to each other in a local network, using little energy and offering great flexibility thanks to its mesh topology.
3a. Key differences between Zigbee and Z-Wave
| Feature | Zigbee | Z-Wave |
|---|---|---|
| Radio frequency | 2.4 GHz (worldwide) | 868 MHz (Europe), 908 MHz (US) |
| Range | 10-30 m (indoor), extendable | 30-50 m (indoor), extendable |
| Rate | ~250 kbps | ~100 kbps |
| Interoperability | Open standard, multi-brand | Closed standard, certified |
| Number of devices | Up to 65,000 | Up to 232 |
| Mesh | Yes | Yes |
| Consumption | Very low | Very low |
| Security | AES 128 bits | S2 Security (AES 128 bits) |
| Cost | Generally more affordable | Often more expensive |
3b. Advantages and disadvantages
Zigbee :
- Advantages:
- Very high mesh capacity (unlimited number of routers, up to 65,000 devices).
- Wide selection of devices, multiple brands, open standard.
- Often lower cost.
- Disadvantages:
- Uses the 2.4 GHz band, which is potentially prone to Wi-Fi interference.
- Interoperability issues between brands (improved with Zigbee 3.0).
Z-Wave :
- Advantages:
- Less congested frequency band (868 MHz), less interference.
- Strict certification, better compatibility between brands.
- Inconvénients :
- Limited to 232 devices per network.
- Equipment is often more expensive.
- Fewer device options, proprietary standard.
Conclusion 1: We will need to optimize the configuration of WiFi and Zigbee networks and channels to minimize the risk of interference between these two protocols. This will be the subject of another article on this blog.
3c. Zigbee network architecture: roles and mesh topology
The three types of Zigbee devices
- Coordinator
- It creates the Zigbee network, assigns addresses, and manages security.
- There is only one per network.
- Example: SLZB-06M, Zigbee USB key.
- Router
- It relays Zigbee messages from other devices.
- It extends the range and robustness of the network.
- Permanently powered (light bulb, connected socket, SLZB-06M specifically flashed to act as a router, etc.).
- Terminal (end device)
- It does not relay messages.
- It communicates only with its “parent” (coordinator or router).
- Often battery-powered (sensor, remote control, etc.).
Mesh topology
In a mesh network, each router can relay Zigbee messages from other devices, increasing the number of possible paths between devices and the coordinator. This increases the range and reliability of the network.
Important : End devices do NOT participate in the mesh network. They only connect to a parent (coordinator or router) and do not transmit messages from others. Only routers and the coordinator actually create the network mesh: they are the ones that relay messages. The more routers you have, the more robust and extensive your network will be.
Conclusion 2: The SMLIGHT SLZB-06M must be configured in controller mode and not router mode, because if it were in router mode, we would need another device capable of acting as a Zigbee controller.
4. Integrating Zigbee into Jeedom via MQTT and Zigbee2MQTT
As we have seen in previous articles, the main advantage of a home automation gateway such as Jeedom is that it centralizes different types of data and automates actions, while remaining “agnostic” with regard to the protocols used. However, there are several possibilities for the technical integration of the Zigbee protocol into Jeedom.
4a. Which Jeedom plugin?
- The official Zigbee plugin: this allows Jeedom to communicate directly with a Zigbee controller (USB key, Ethernet gateway such as the SLZB-06M) without any additional intermediary. It is based on the open-source library Zigpy to ensure broad compatibility with a wide range of Zigbee hardware.
- Advantages:
- Simple and straightforward integration,
- Interface native Jeedom,
- No need to install MQTT or other services.
- Limits:
- Less advanced customization than Zigbee2MQTT,
- Less support for certain exotic modules.
- Advantages:
- The JeeZigbee plugin acts as an interface between Jeedom and the Zigbee2MQTT software (also sometimes called the Z2M library), which manages the Zigbee network and exposes all Zigbee objects on the network via the MQTT protocol by “sending” them as messages to an MQTT broker (e.g., Mosquitto software). The MQTT broker therefore acts as an intermediary: it publishes messages from Zigbee2MQTT and Jeedom (or other “clients”) will receive them by reading them on the MQTT broker via the Jeezigbee plugin.
- Advantages:
- High compatibility with numerous modules, including exotic ones,
- Zigbee2MQTT web interface for advanced network management,
- Possibility to customize converters for modules not natively supported.
- Limits:
- More technical installation and configuration (multiple services to be connected),
- Dependency on MQTT.
- Advantages:
- The ZigbeeLinker plugin also allows you to integrate Zigbee into Jeedom via Zigbee2MQTT and MQTT, with several possible installation modes (all local, remote antenna, etc.). It can be useful if you want a different or more customized Zigbee2MQTT/MQTT integration, perhaps even more advanced.
Summary table
| Plugin | Does it require MQTT? | Additional installation | Key benefits | Who is it for? |
|---|---|---|---|---|
| Zigbee (official) | No | No | Simple, native, stable | Beginners, standard use |
| Jeezigbee (Z2M) | Yes | Zigbee2MQTT + MQTT | Official Jeedom plugin, highly compatible, customizable | Advanced users, better support for exotic modules |
| ZigbeeLinker | Yes | Zigbee2MQTT + MQTT | Flexible, multi-modes | Specific requirements, multi-Jeedom, support for exotic modules |
Conclusion
Before choosing the plugin, we must first choose the type of architecture: simplified without MQTT, or with MQTT. For our use case, we will choose to use MQTT for the following reasons:
- Architectural independence and robustness
- The Zigbee coordinator (e.g., SLZB-06M) will simply manage the radio network. Zigbee2MQTT will handle the interpretation, management, and translation of Zigbee messages into MQTT for Jeedom.
- If Jeedom restarts or crashes, the Zigbee network and its communications will continue via Zigbee2MQTT/MQTT. System resilience will be increased, as the “Zigbee gateway” will continue to function even if the central home automation engine (Jeedom) becomes unavailable.
- Universality and interoperability
- Zigbee2MQTT allows multiple systems to simultaneously access information from Zigbee devices: it makes all equipment integrable simultaneously by Jeedom, Home Assistant, Node-RED, OpenHAB, etc. All they need to do is be able to read MQTT topics. It is no longer a proprietary gateway associated with a single system.
- This allows the same Zigbee network to be shared across several parallel (or transitional) home automation platforms.
- Broad compatibility and scalability
- Zigbee2MQTT supports thousands of Zigbee modules, including those poorly recognized by native plugins. Its community is constantly contributing to the addition of new models.
- Adding a rare module, customizing its functions, and quickly testing the latest integrations is—according to my research—easier with Zigbee2MQTT.
- Message centralization (MQTT)
- Loose coupling architecture: Thanks to MQTT, each component (Zigbee, Z-Wave, controllers, Jeedom, etc.) communicates independently with its peers via the broker. This facilitates supervision, analysis, automation, and even redundancy/replication of the system.
- Clear separation of responsibilities:
- The coordinator manages the radio network,
- Zigbee2MQTT handles protocol conversion and software management.
- MQTT centralizes exchanges,
- Jeedom orchestrates everything and reads the information it needs from MQTT.
- Automatic discovery and integration
- Auto-discovery: Zigbee2MQTT dynamically publishes the complete configuration of the modules (names, commands, statuses, etc.) to MQTT, which Jeedom can use to automatically generate the associated Zigbee devices, without requiring the user to configure everything manually.
As for the plugin, we will use JeeZigbee, the official plugin supported by the Jeedom team, which also allows for great configuration flexibility. Please note that it will cost €6 (the same as the ZigbeeLinker plugin).
Now let’s take a closer look at the architecture with MQTT, as the official ZWave plugin also uses it.
4b. Software architecture with MQTT
Message Queuing Telemetry Transport (MQTT) is a messaging-based M2M (machine-to-machine) communication protocol that enables devices to communicate asynchronously across constrained networks to remote systems. Each MQTT client, application, or data processing device, whether a data producer or consumer, must connect to a central server (the MQTT broker) before communicating with other MQTT clients via messages published on a specific topic. The server accepts messages published on topics and delivers them to consumers interested in those topics according to a publish/subscribe interaction model. Multiple clients, producers, or consumers can subscribe to the same topics and use the information as they see fit.
In Jeedom, the software architecture for using ZWave and Zigbee could be described as follows.
| Component | Main role |
|---|---|
| Zigbee objects | Sensors, actuators, sockets, light bulbs, etc.: these are Zigbee peripherals. |
| Z-Wave devices | Sensors, actuators, etc. using the Z-Wave protocol. |
| Zigbee Coordinator | Physical gateway (e.g., SLZB-06M): communicates with objects via Zigbee and with the server via USB/ETH. |
| Z-Wave Controller | Z-Wave USB dongle or physical gateway that connects Z-Wave devices to the server. |
| Zigbee2MQTT (Z2M) | Software service (virtual gateway): converts Zigbee messages from the coordinator into MQTT topics, and vice versa. |
| Z-Wave JS | Software service (virtual gateway): converts Z-Wave messages into MQTT topics, and vice versa. |
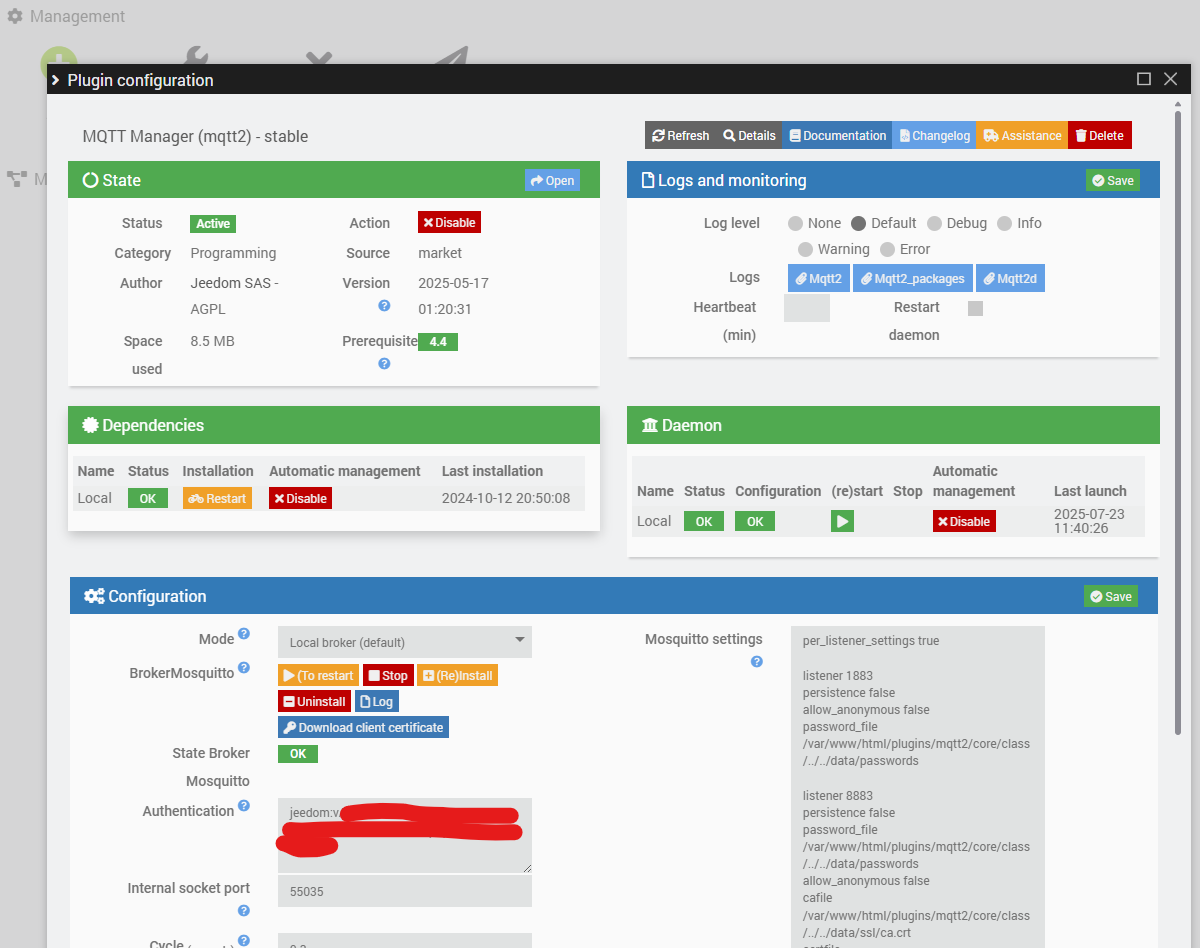
| Mosquitto (MQTT Broker) | Central MQTT messaging server on which Z2M, Z-Wave JS, and Jeedom exchange messages. |
| MQTT Manager (mqtt2) | Jeedom plugin that allows the integration of an MQTT broker into Jeedom. It can also read/publish statuses and commands directly on the MQTT broker. |
| Jeedom | Central home automation platform, orchestrator of equipment and automation. |
Each protocol has its own hardware controller and software service that “speaks” MQTT—this is the broker that centralizes all communications to Jeedom via the MQTT Manager plugin.
                       +-----------------------------+
                       |           JEEDOM            |
                       |                             |
                       +-------------+---------------+
                                     |
                          +----------v----------+
                          | MQTT Manager Plugin |
                          +----------+----------+
                                     |
                               <mark style="background-color:rgba(0, 0, 0, 0)" class="has-inline-color has-vivid-red-color">+-----v------+
                               |   MQTT     |    ← Broker, central hub
                               | (Mosquitto)|
                               +-----+------+</mark>
                                     |
                         +-----------+-------------+
                         |                         |
                  +------v-------+         +-------v-------+
                  |  ZWave JS    |         | Zigbee2MQTT   |
                  +------+-------+         +------+--------+
                         |                        |
                  +------v-------+         +------v--------+
                  |    ZWave     |         |     Zigbee    |
                  |  Controler   |         |  Coordinator  |
                  +----+----+----+         +----+-----+----+
                       |    |                   |     |
                  object... objects...    object...  objetcs...
                  (ZWave)  (ZWave)        (Zigbee)   (Zigbee)Code language: HTML, XML (xml)
4c. General architecture of the future installation
I have tried to represent as simply as possible, on the one hand, the general functional architecture with the components used to monitor this remote meter and, on the other hand, the Jeedom objects that we will manipulate using these components.
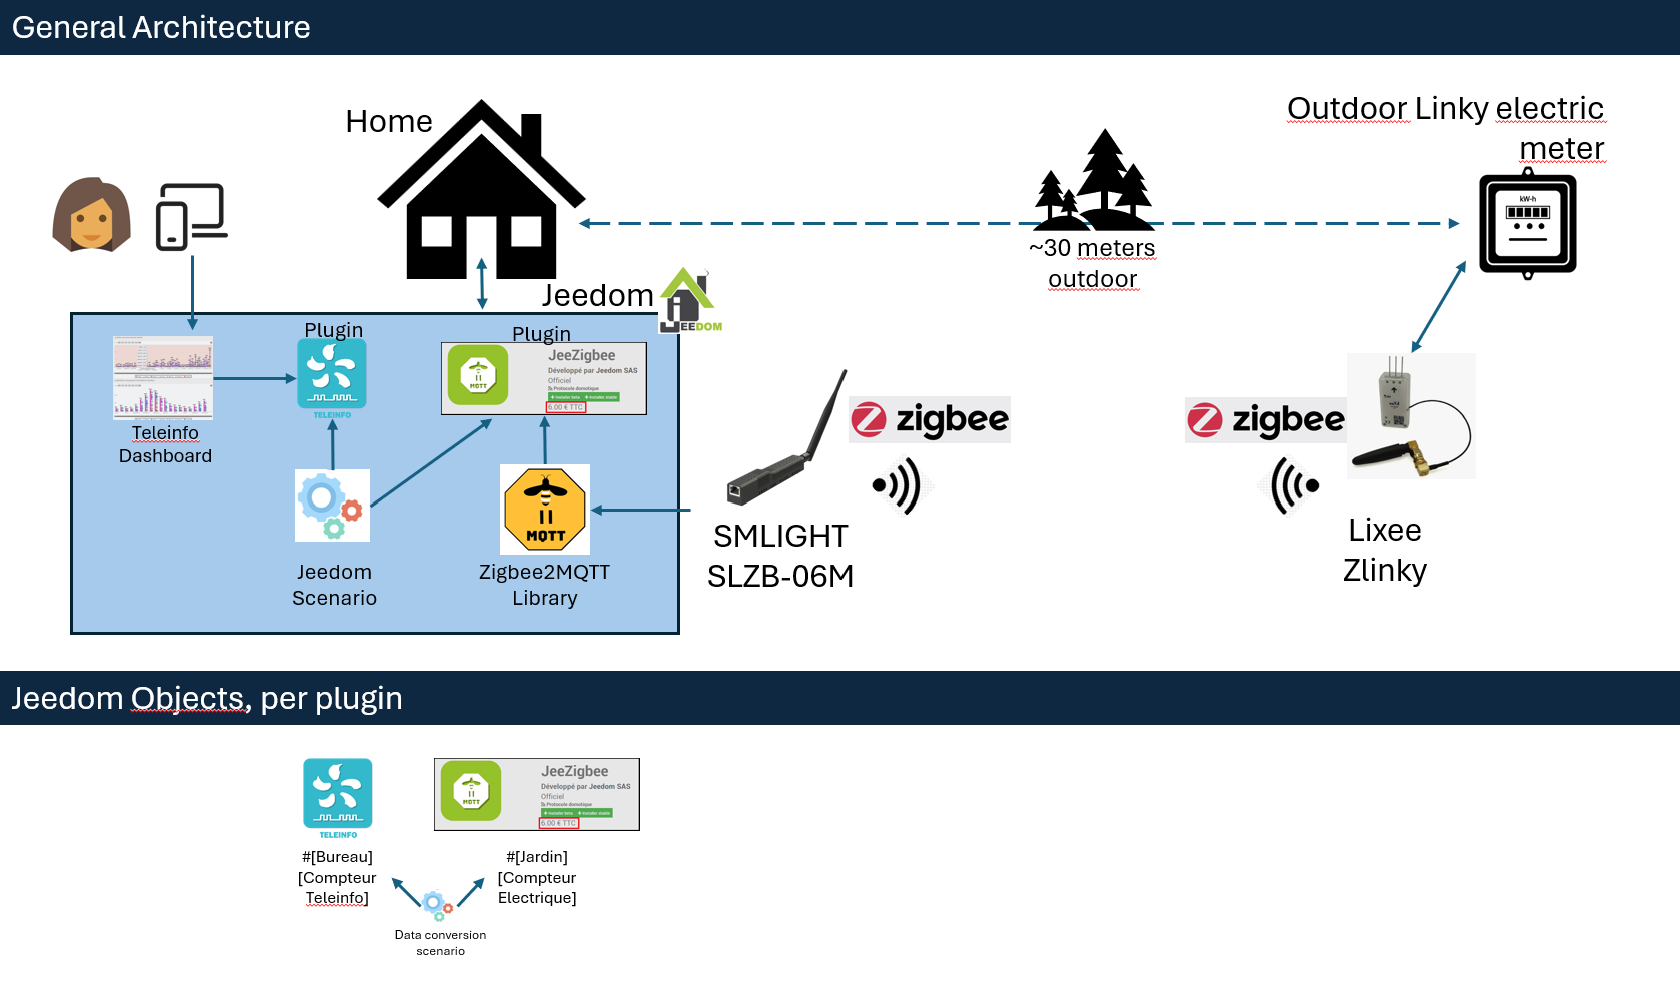
Here we find the components listed above and note that despite the necessary software and hardware stack, in the end only two Jeedom objects will actually be used: the “garden” electricity meter seen by the JeeZigbee plugin (also called Z2M) and the “Teleinfo” electricity meter seen by the Teleinfo plugin, which produces a dashboard that can be viewed by the end user.
5. Practical installation
In our case, i.e., a central home automation server, all these software components are actually installed and configured in a simple manner via Jeedom plugins that handle dependency management at the operating system level. Everything runs on the same computer: Jeedom, the MQTT broker, the Zigbee2MQTT gateway, and the Zigbee Coordinator is connected to this computer.
5a. Dependencies: MQTT Broker & MQTT Manager Plugin
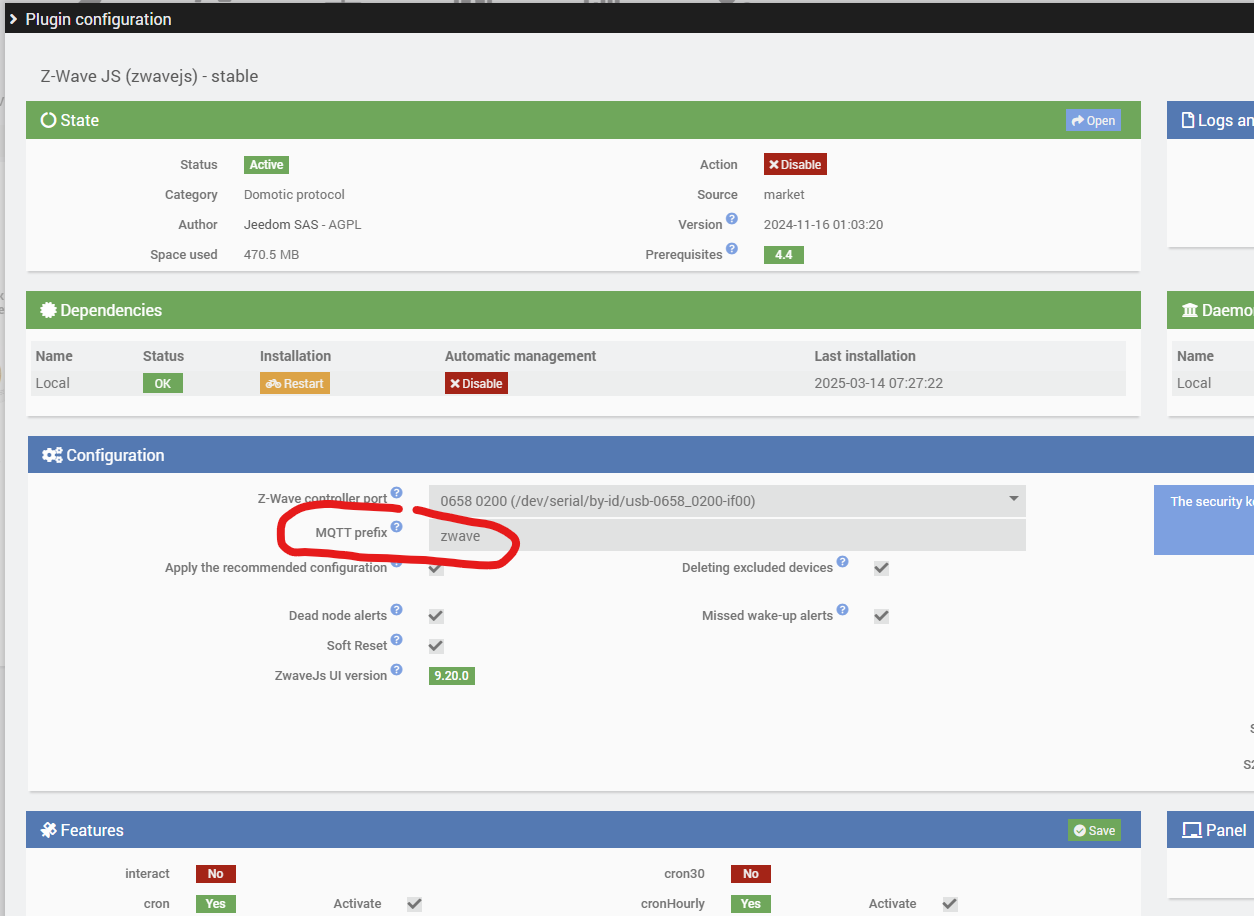
This Zigbee installation is actually simplified because… The Jeedom ZwaveJS plugin that we already use (and which deploys the ZwaveJS software) also uses an MQTT broker. Therefore, when the ZWaveJS plugin was installed, it automatically installed the MQTT Manager plugin, which itself deployed a local Mosquitto broker on the machine!

5b. Deployment of the SLZB-06M coordinator
Wiring
One of the advantages of the SLZB-06M is that it can operate via Wi-Fi, Ethernet, or USB. When used with Wi-Fi, it also requires an external USB power supply. When used with Ethernet, it supports PoE (Power over Ethernet) power supply.
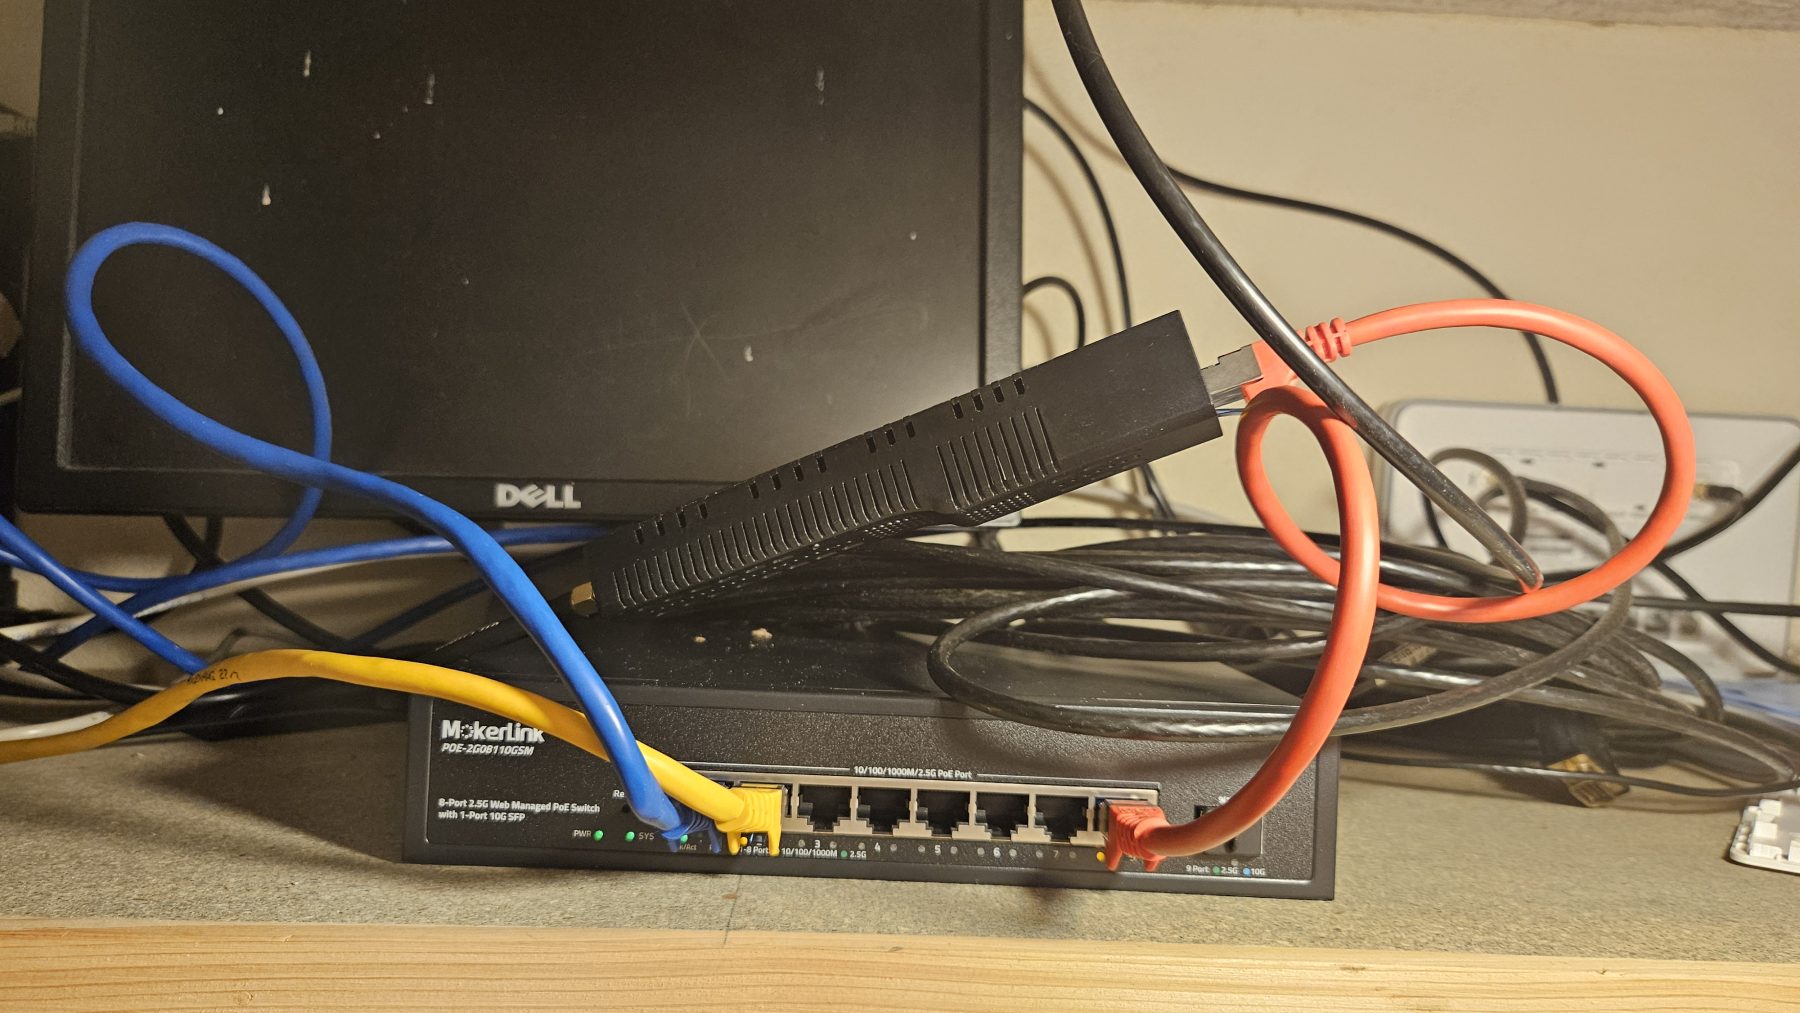
Considering that a wired network is more reliable than a wireless network, the choice is easy: we connect the PoE switch to our Internet box, to Jeedom, which was previously connected directly to the Internet box, and to the SLZB-06M.
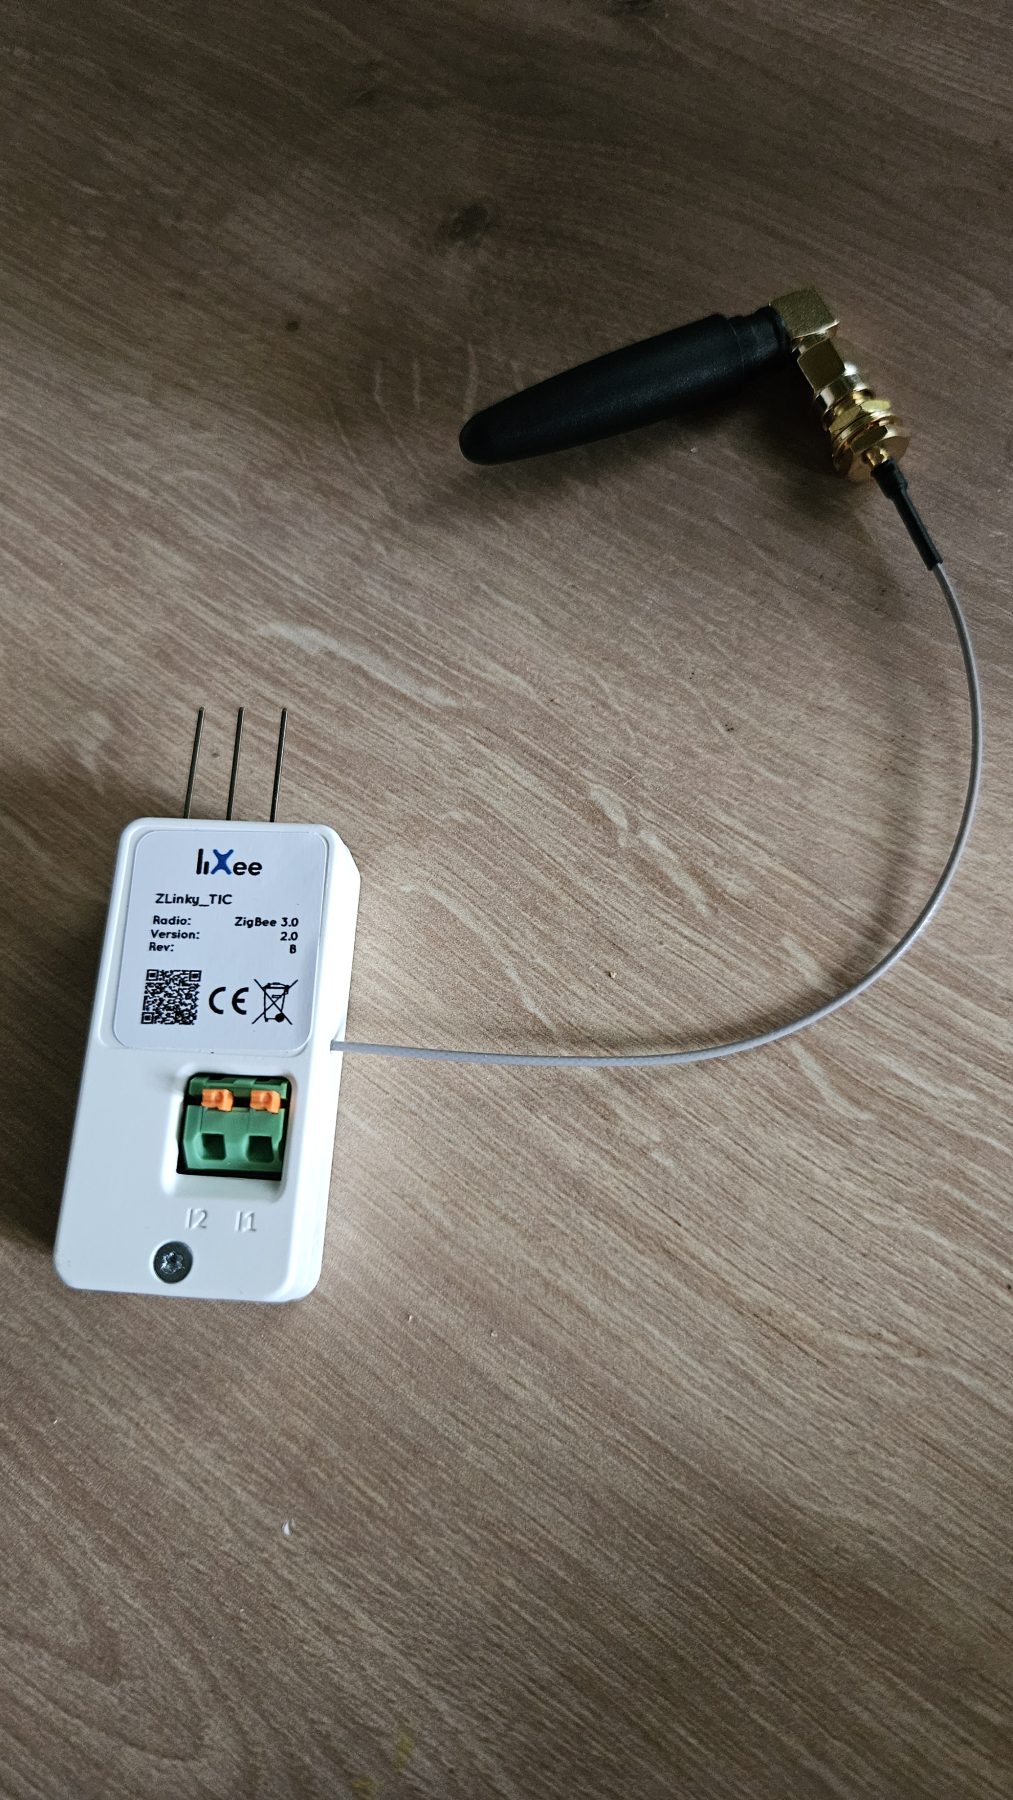
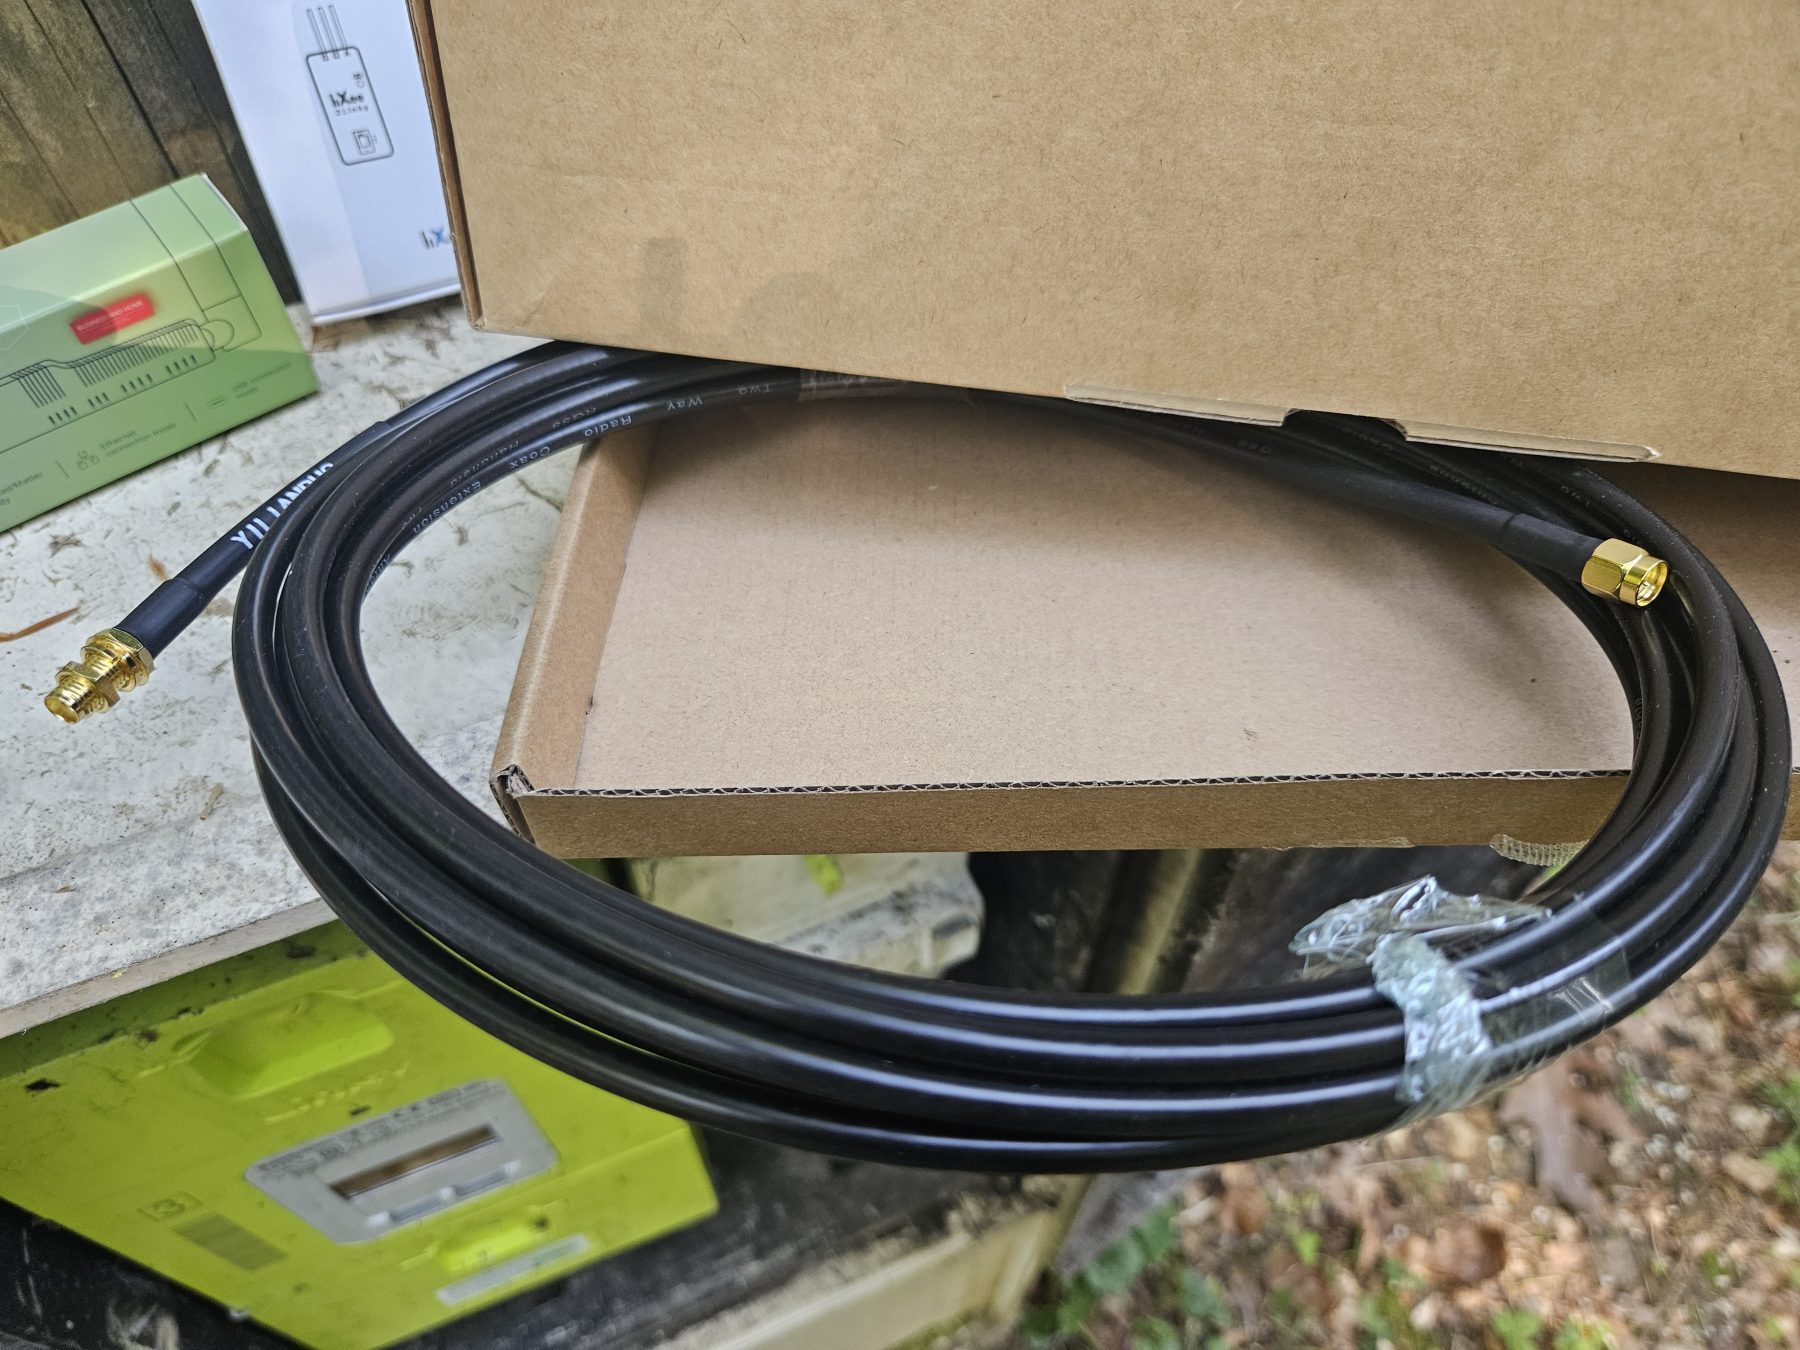
The SLZB-06M antenna is replaced by an SMA cable extension, the other end of which leads outside the house, on the same side as the electricity meter to be connected. At this stage, I have no guarantee that this initial test under “ideal” conditions will work and enable remote pairing of the Lixee module.

Configuration interface
The module registers itself on the network (via mDNS) and is theoretically directly accessible at the address http://slzb-06m.local. In any case, we will change and set its IP address on the Internet router (which also acts as a DHCP server) and, at worst, we will be able to access its interface directly via its IP address.


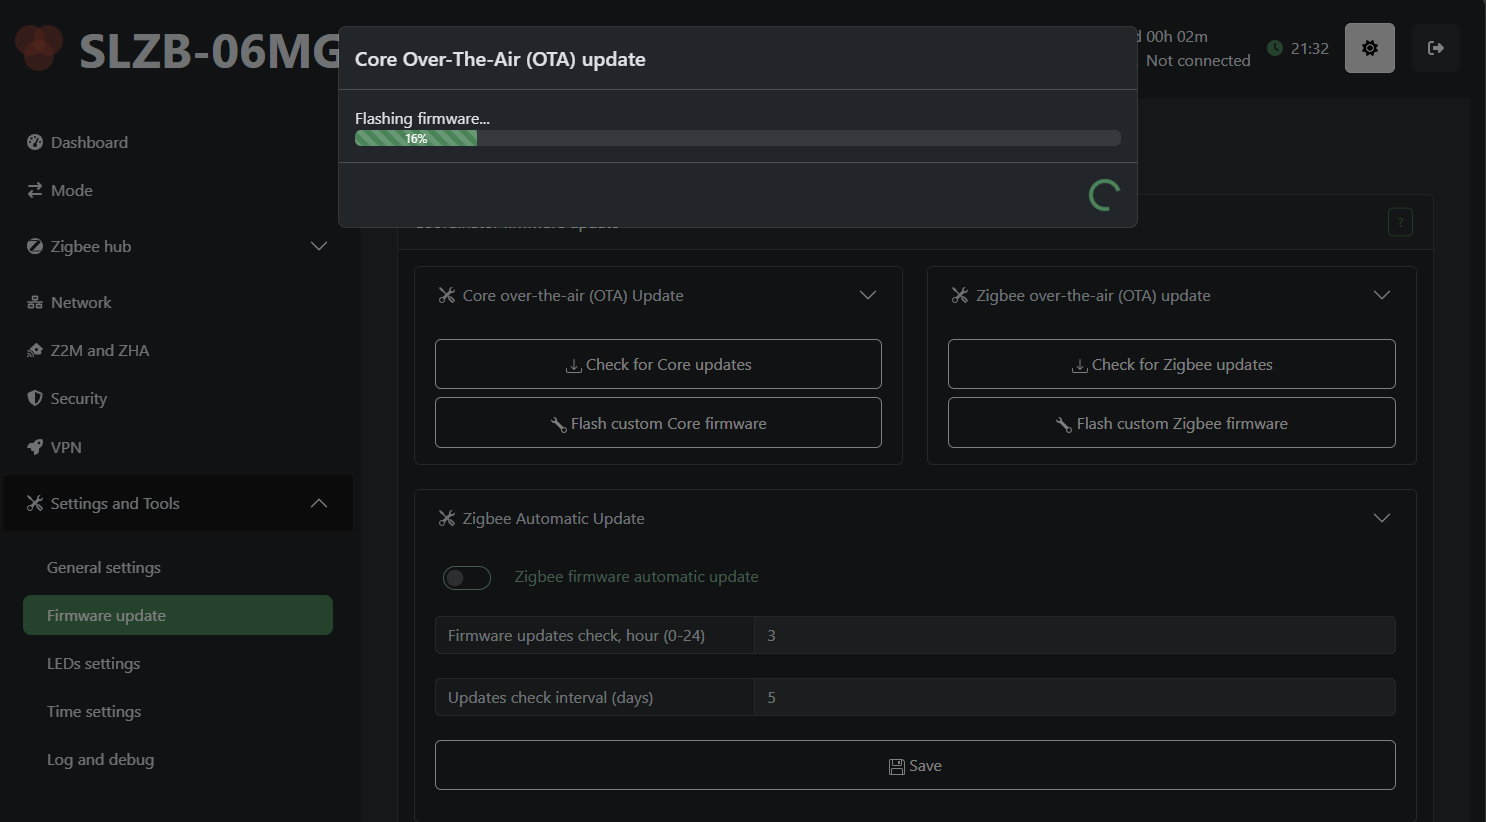
First, we check if any updates are available. We note that the user interface is very clear, explicit, and pleasant to use.
Don’t forget to enable HTTP authentication and choose a password of appropriate length. Negative point: I have NOT found how to enable an HTTPS administration endpoint instead of the default HTTP.
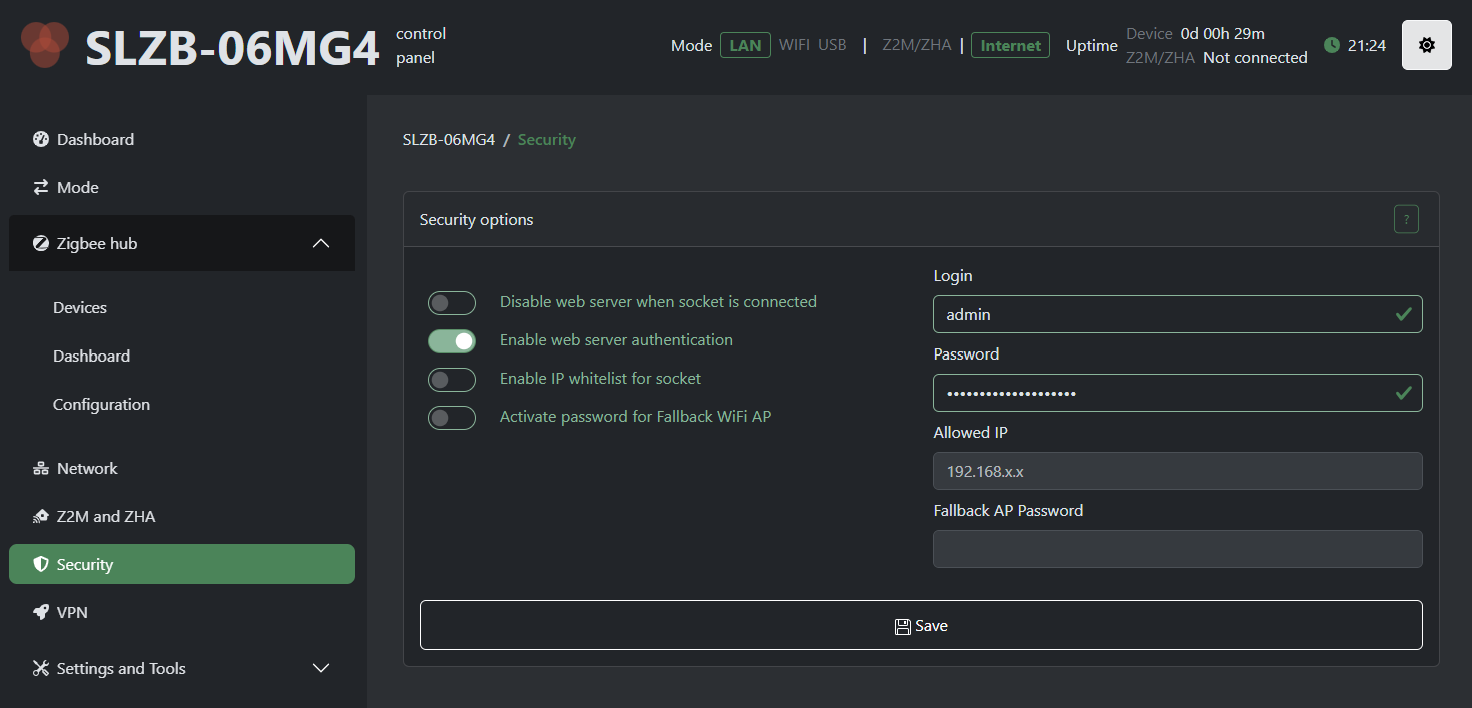
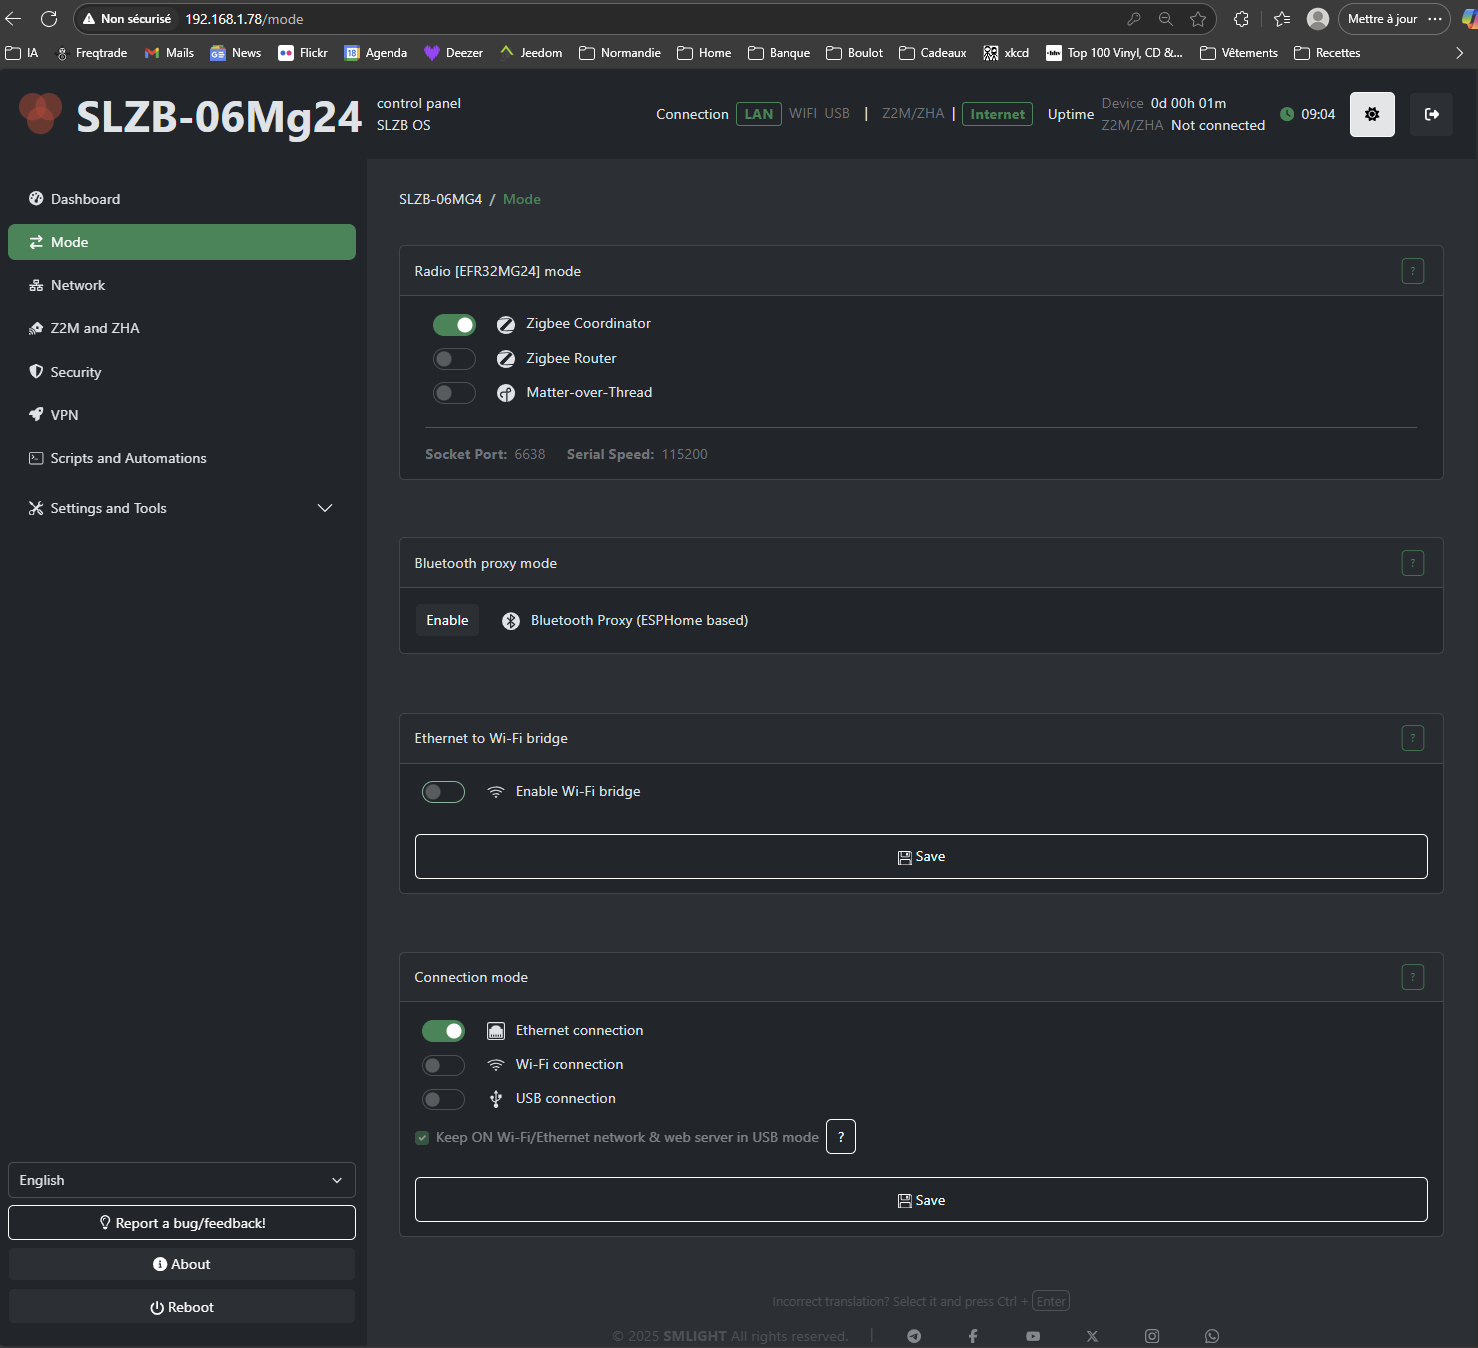
On the “Mode” tab, we can check that it is correctly configured in coordinator mode. This is important because it can also be configured in router mode, which would not work in our case (a coordinator is required first).
5c. JeeZigbee/Zigbee2MQTT Plugin
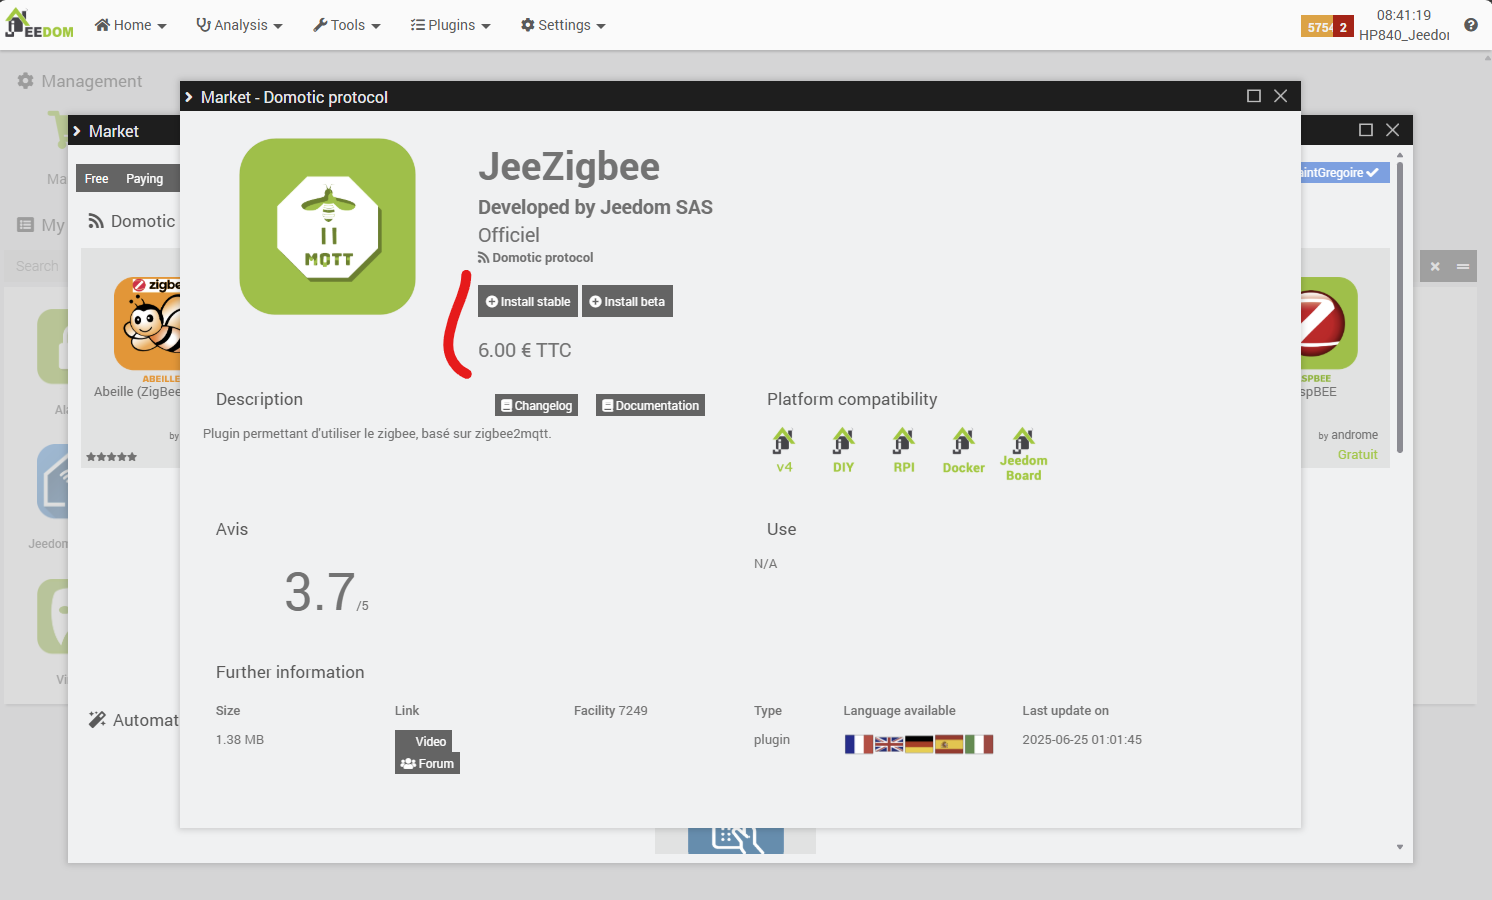
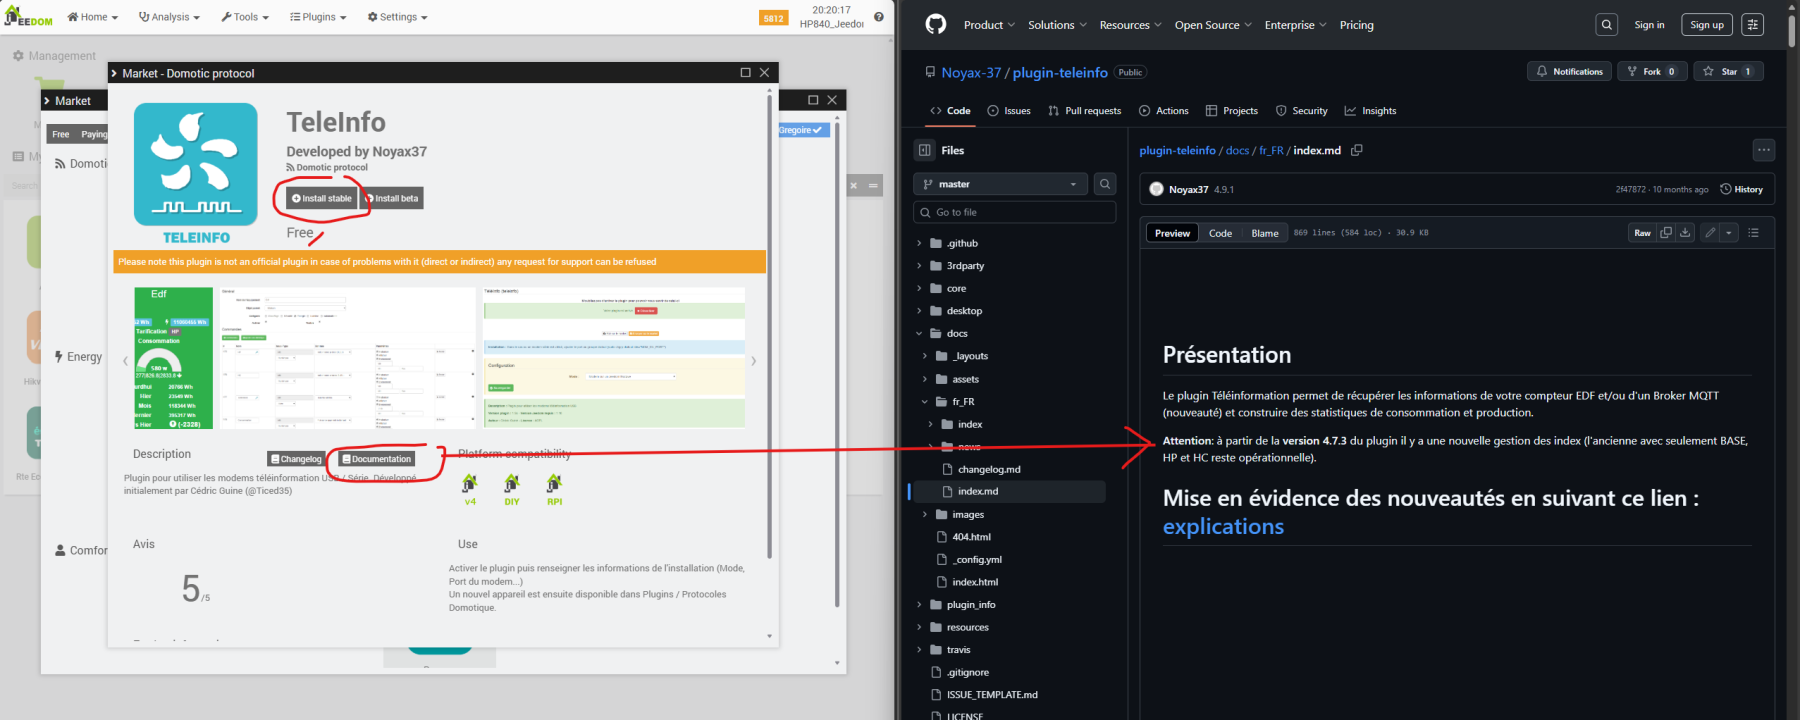
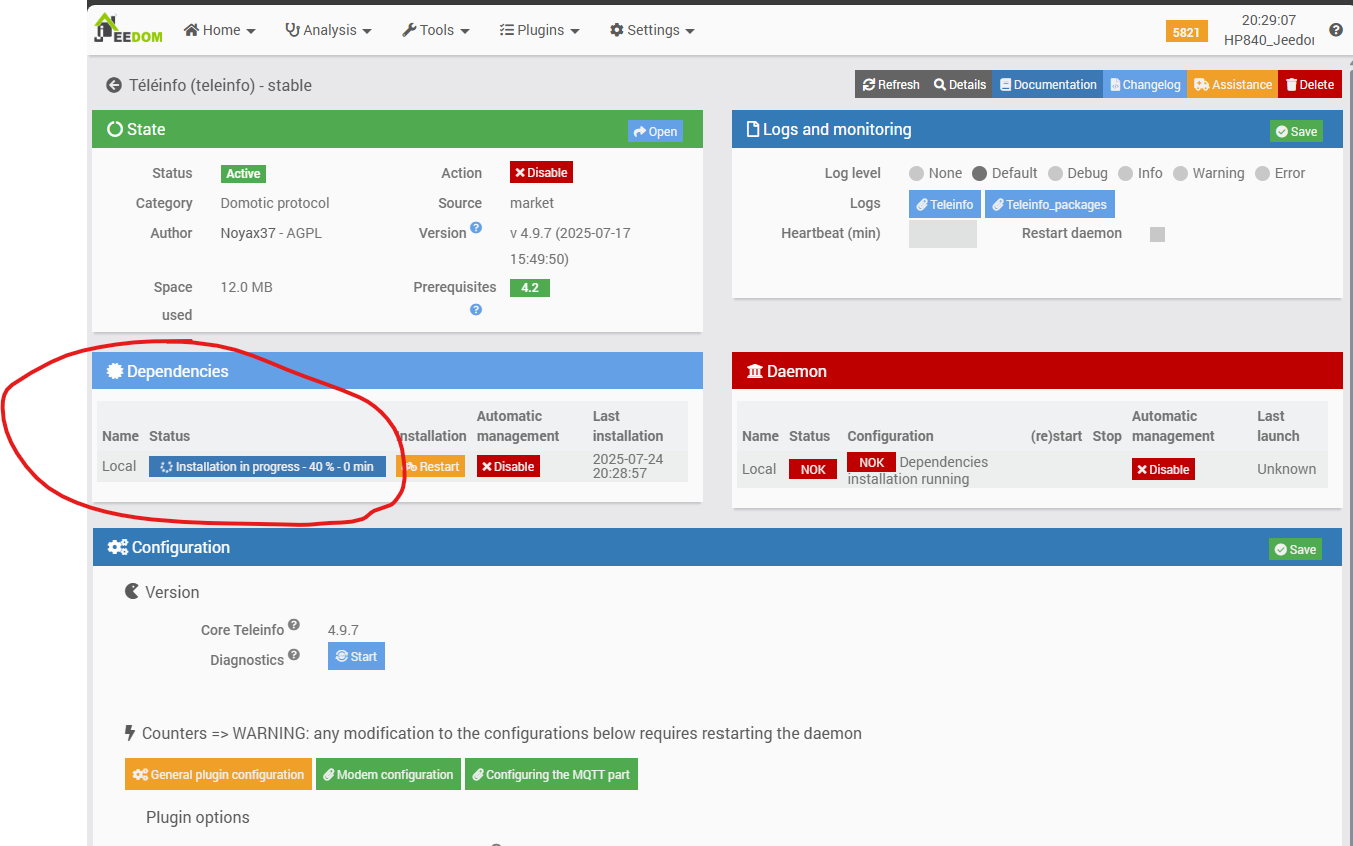
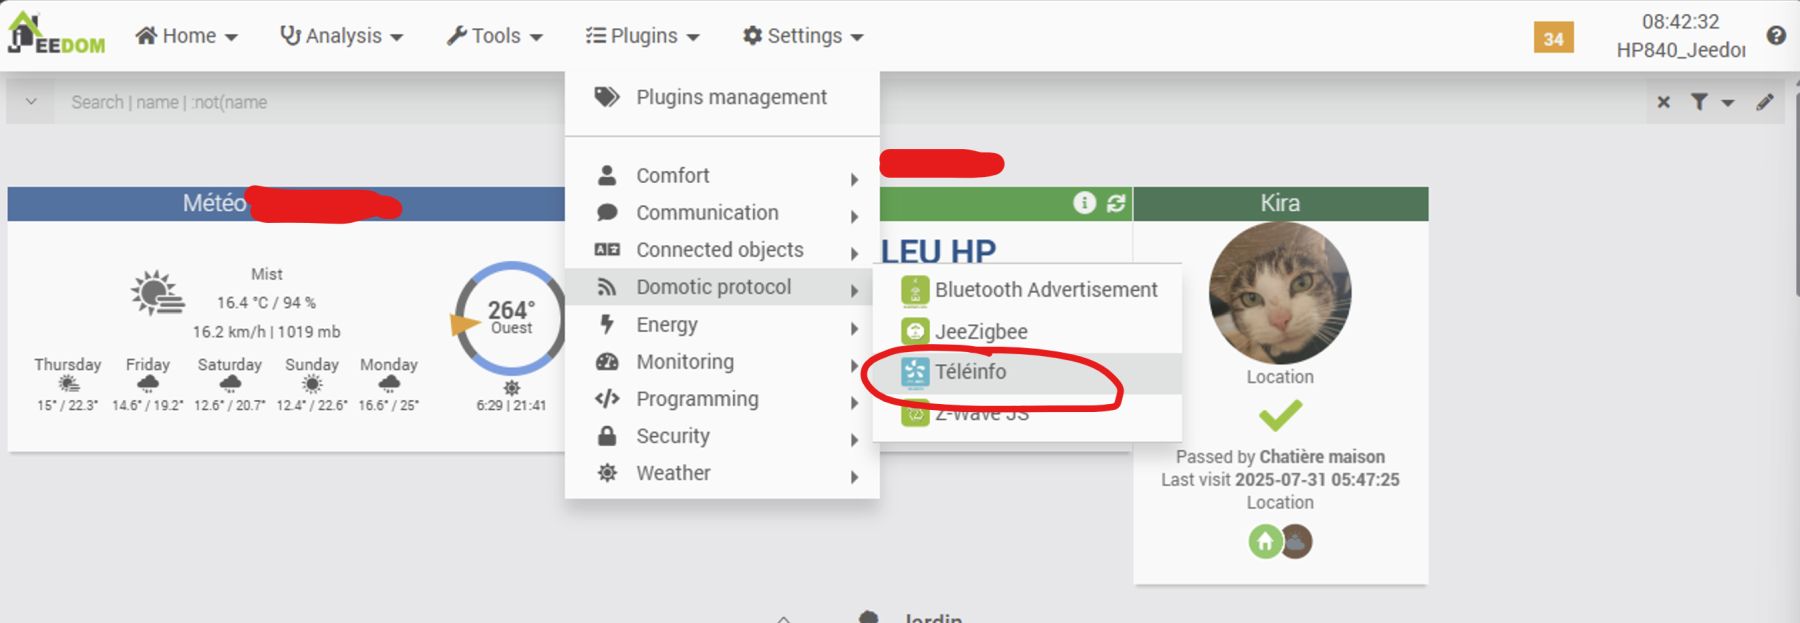
From the Jeedom administration interface, go to the Market and install the JeeZigbee module (also sometimes called Zigbee2MQTT). We will install the Stable version.
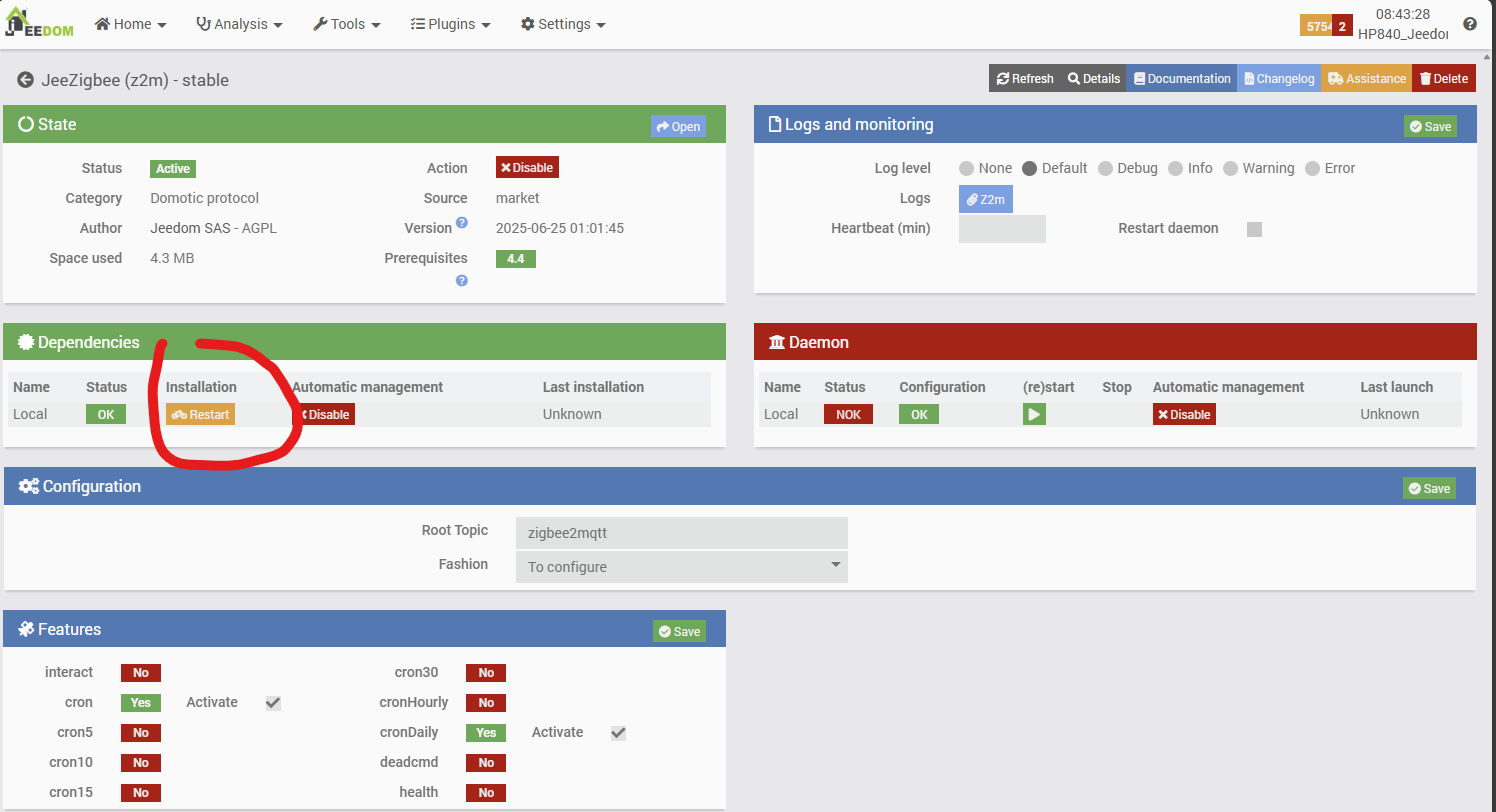
Next, we will check the dependencies to be installed. This is a very important step.
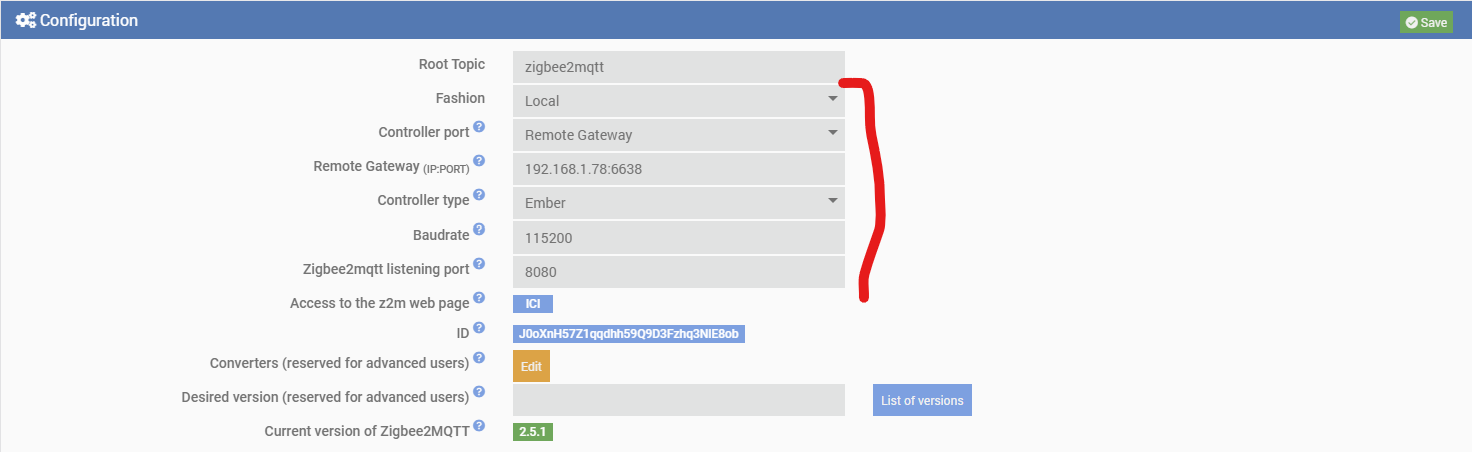
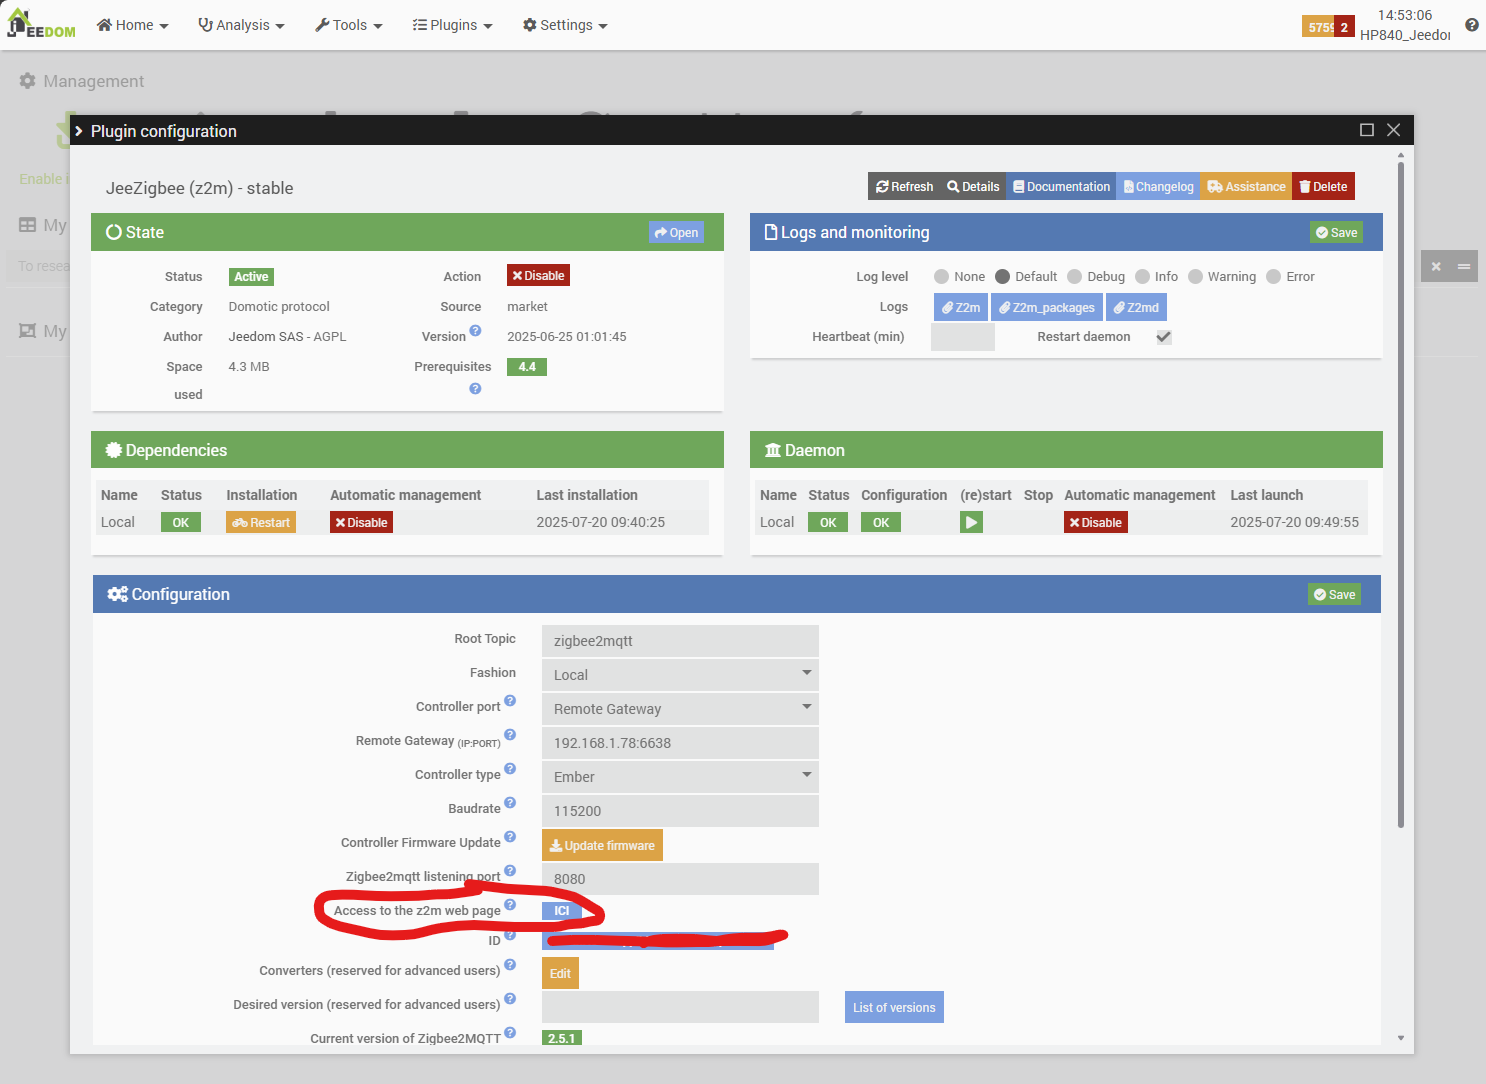
We will now configure the plugin so that it can communicate with the SLZB-06M coordinator. We will need the IP address and port that we saw earlier when configuring the coordinator. Note that we will use the latest recommended protocol for Zigbee: Ember.
This configuration complies with the configuration suggested on page SLZB-06M Z2M:
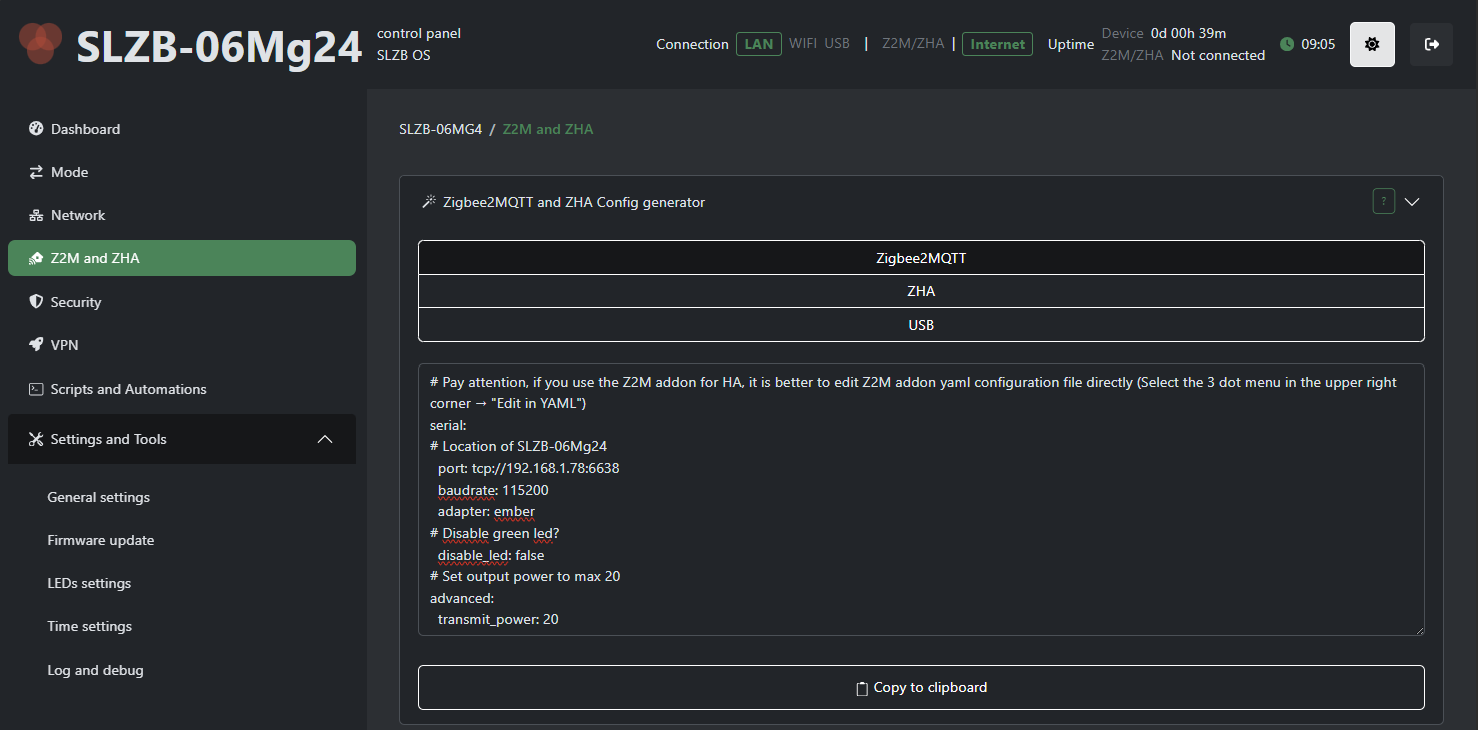
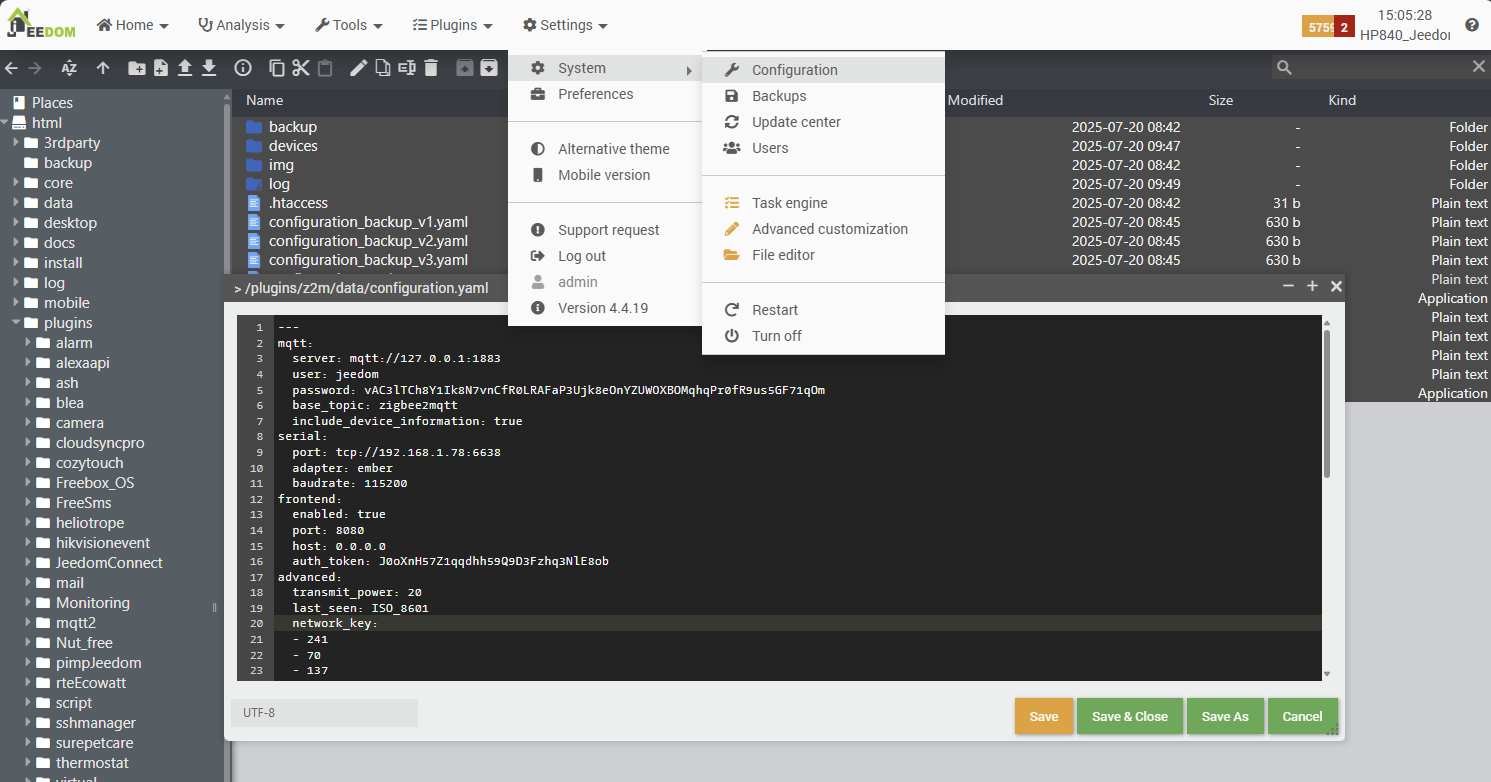
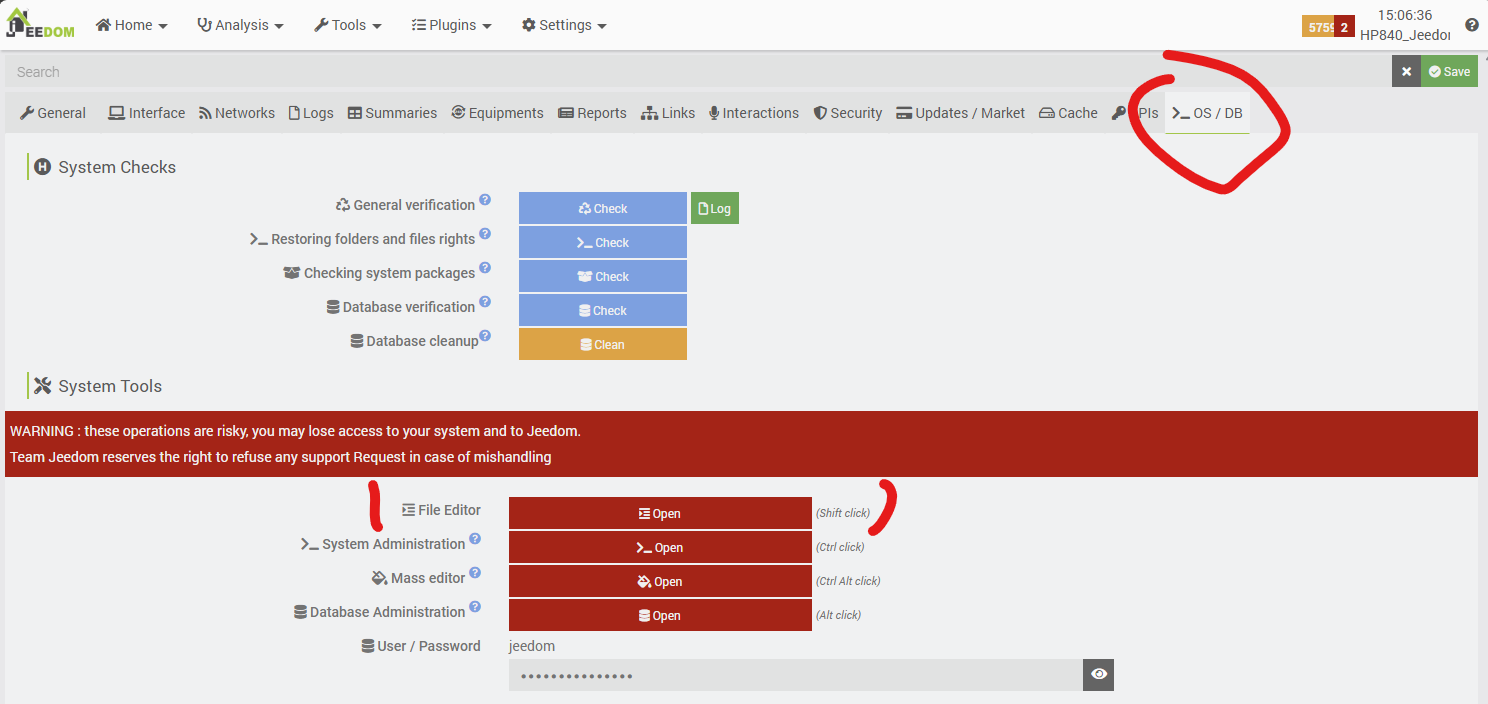
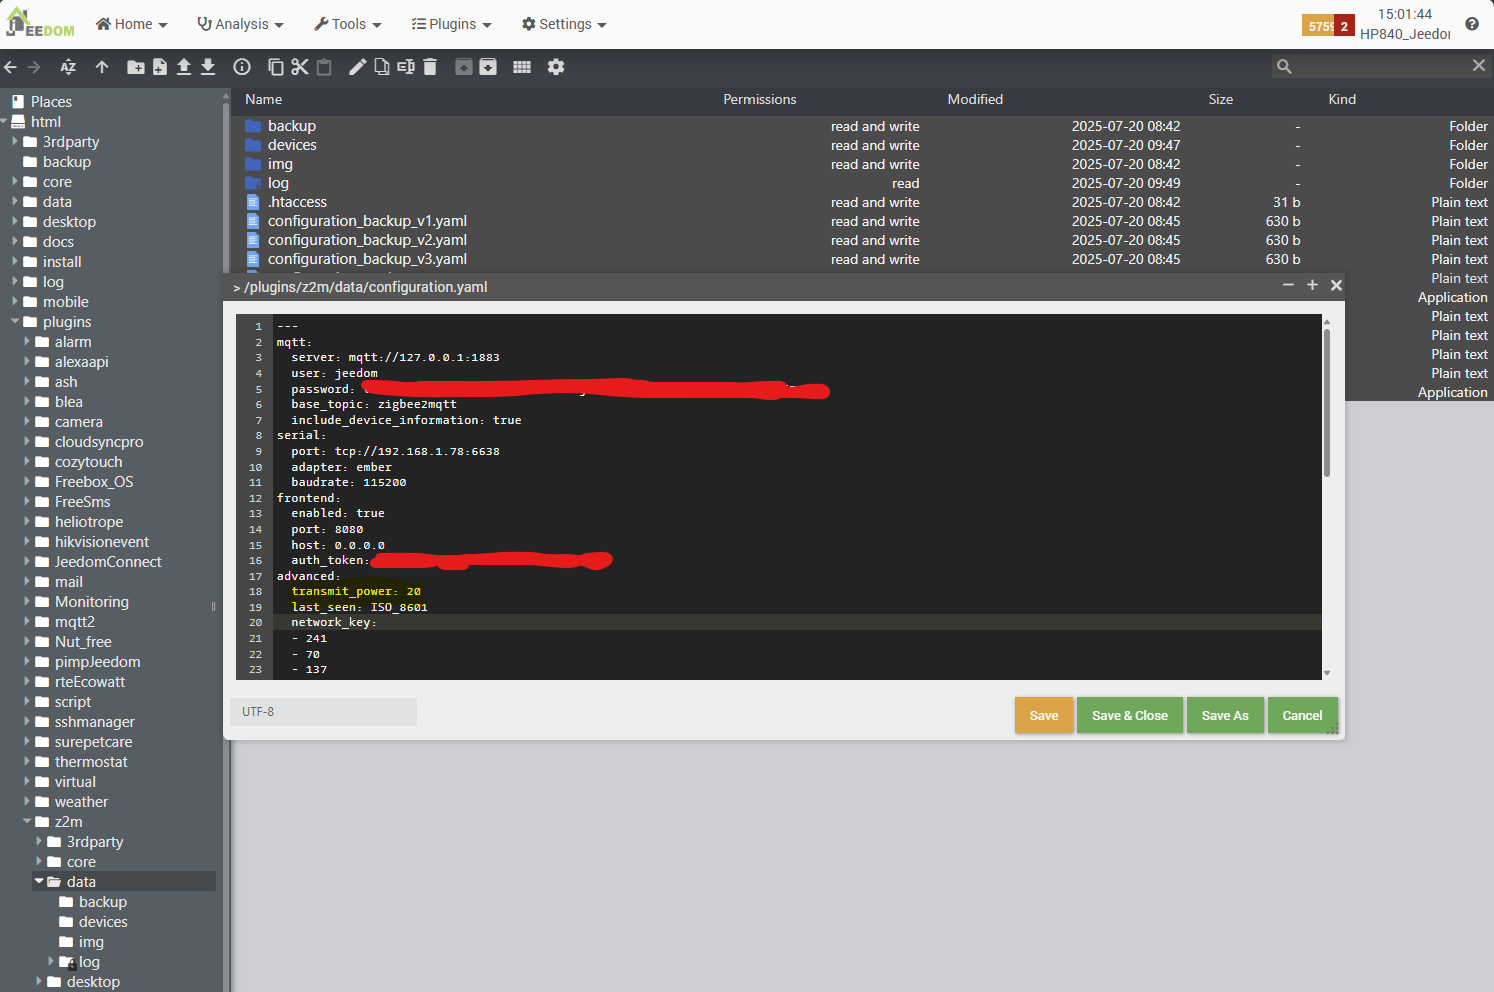
We will also add a specific transmit_power parameter to force the transmission power to its maximum 20 (versus 5 by default) directly in a configuration file of the JeeZigbee/Z2M plugin in Jeedom, as the plugin configuration page interface does not allow you to enter it. To do this, we use the file editor embedded in the & Menu Settings/System/Configuration tab.
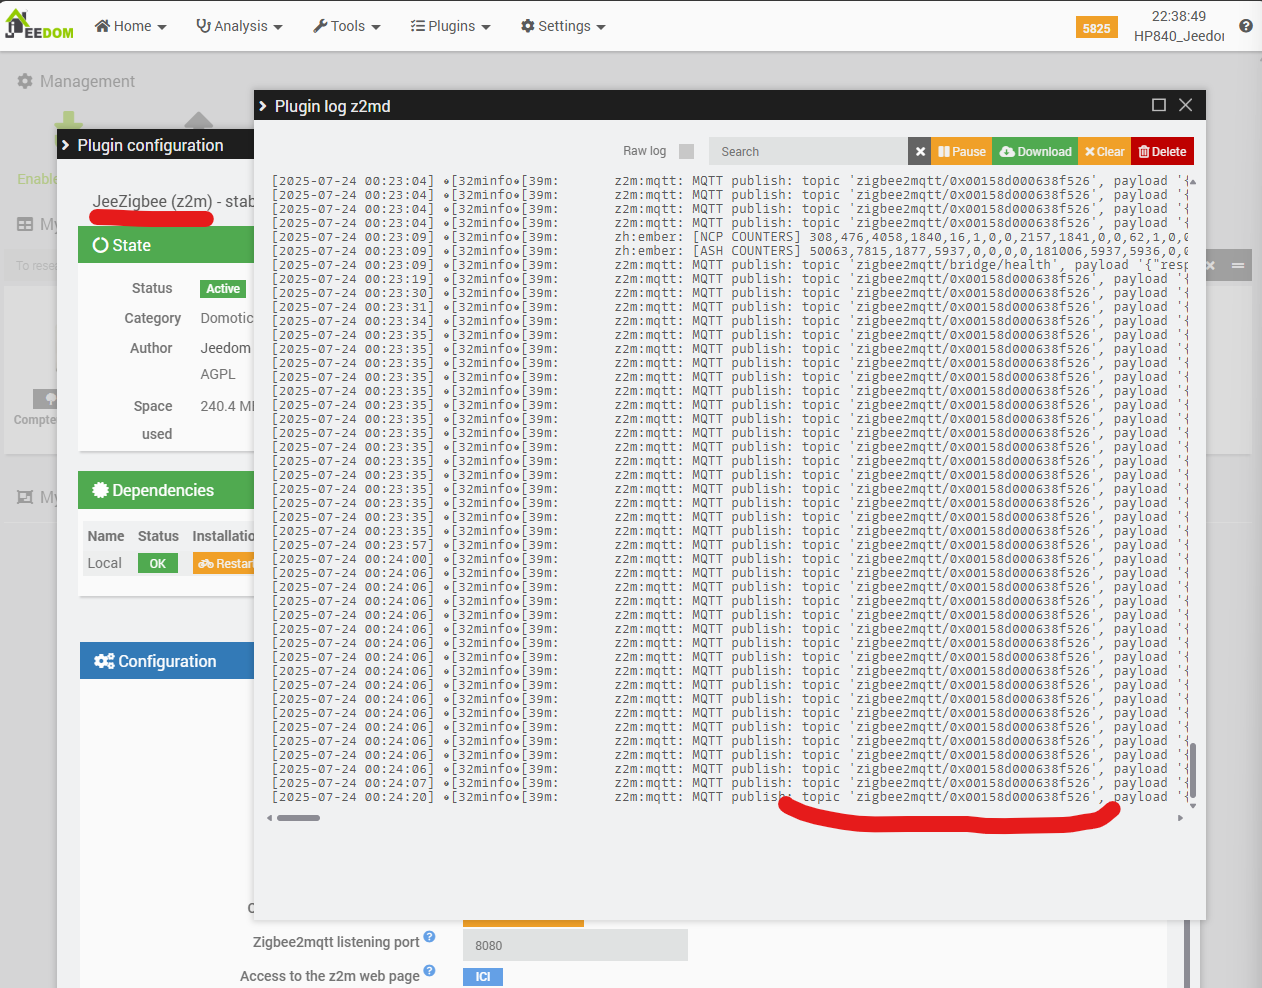
You will need to restart the daemon on the configuration page for these settings to take effect. A quick check in the Z2md log file, by clicking on the small blue button at the top right, should show that there are no errors and that the Embed protocol is being used.

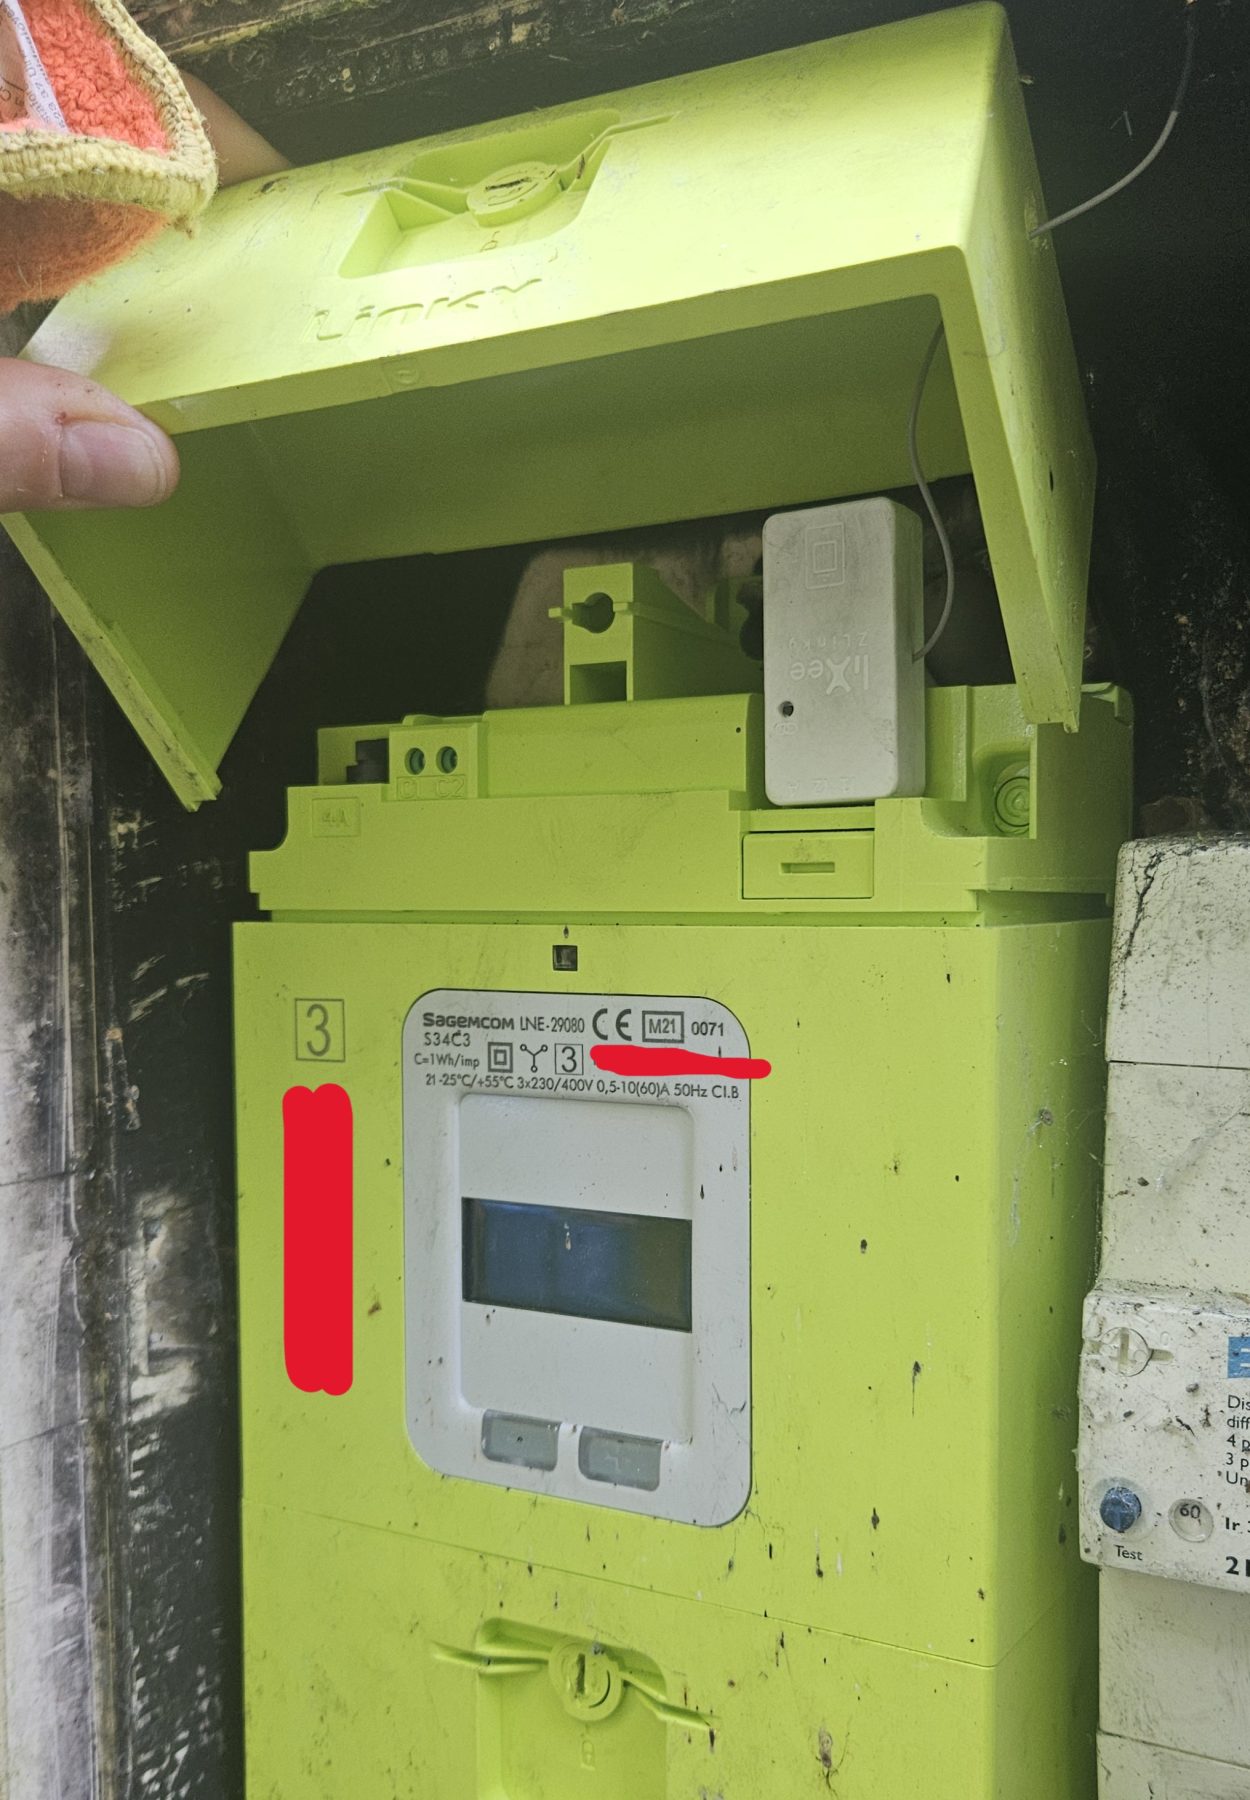
5d. Connecting the controller to the meter & inclusion
Since the Lixee module also uses a remote antenna, we will need to drill a hole in the electrical cabinet and secure the antenna passage to prevent any possibility of water intrusion. So, before doing this, we will carry out an initial “open cabinet” test to check whether the Lixee_TIC module and the controller can “see” each other and whether the module can be remotely added to the Zigbee network.
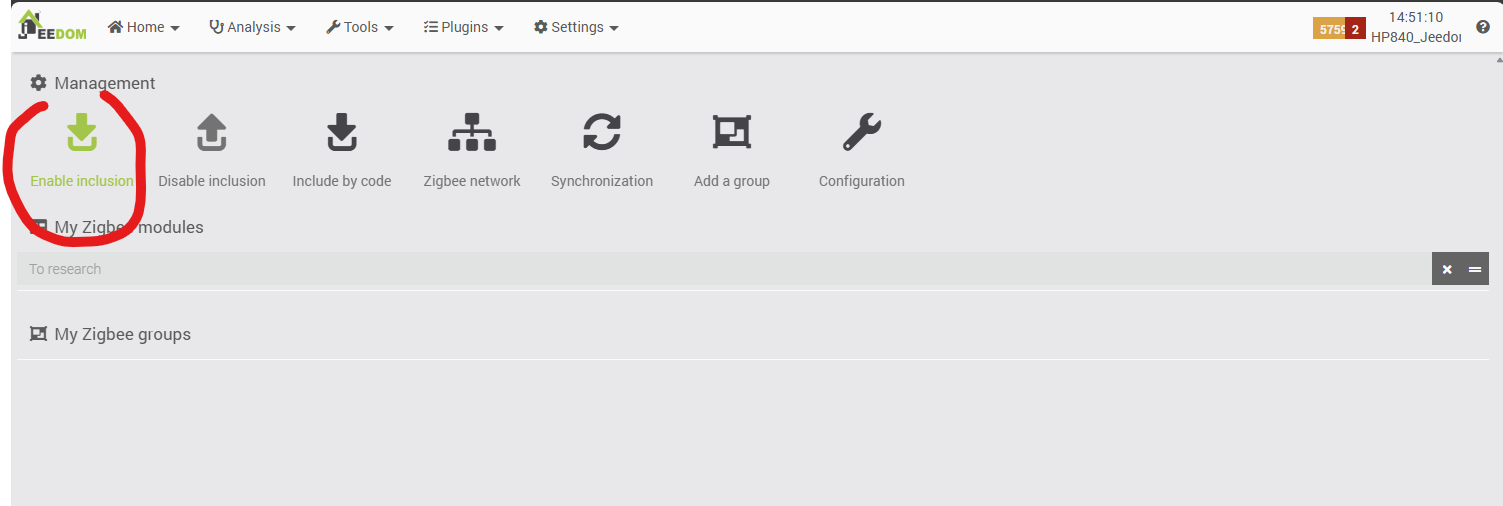
The Lixee Zlinky_TIC automatically switches to inclusion mode as soon as it is connected to the Linky electricity meter. No additional action is required on the module side, so the only thing we need to do is switch the controller to inclusion mode:
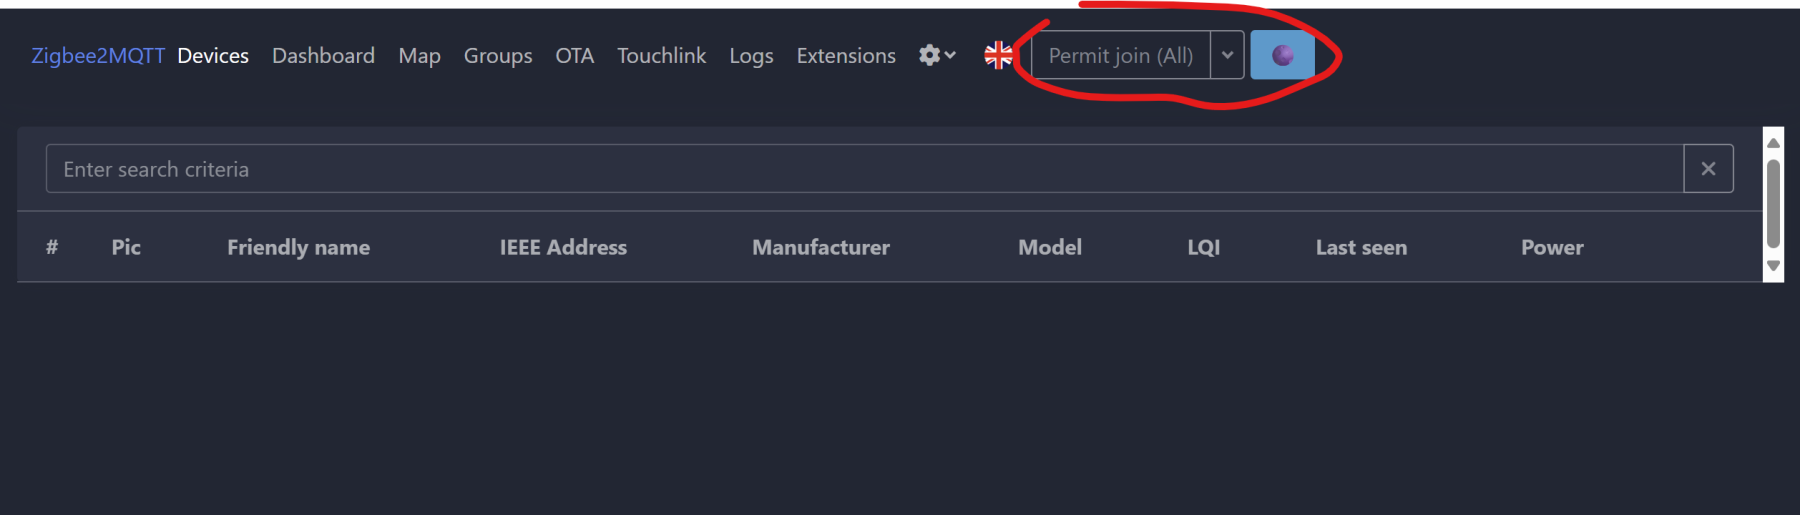
- Either from the configuration page of the Jeedom Zigbee2MQTT plugin
- Either directly from the Zigbee2MQTT dashboard accessible from the Jeedom JeeZigbee/Zigbee2MQTT plugin configuration page (using the ID indicated under the button).
Now, we physically connect the Lixee Zlinky…

This step is absolutely crucial in our process, as it shows that despite the distance, the inclusion of the Lixee module from the electricity meter to the controller went smoothly. This bodes well for the future: in general, the inclusion step is the most sensitive and unpredictable. We will subsequently check the quality of the connection, its evolution, and even its optimization in another article.
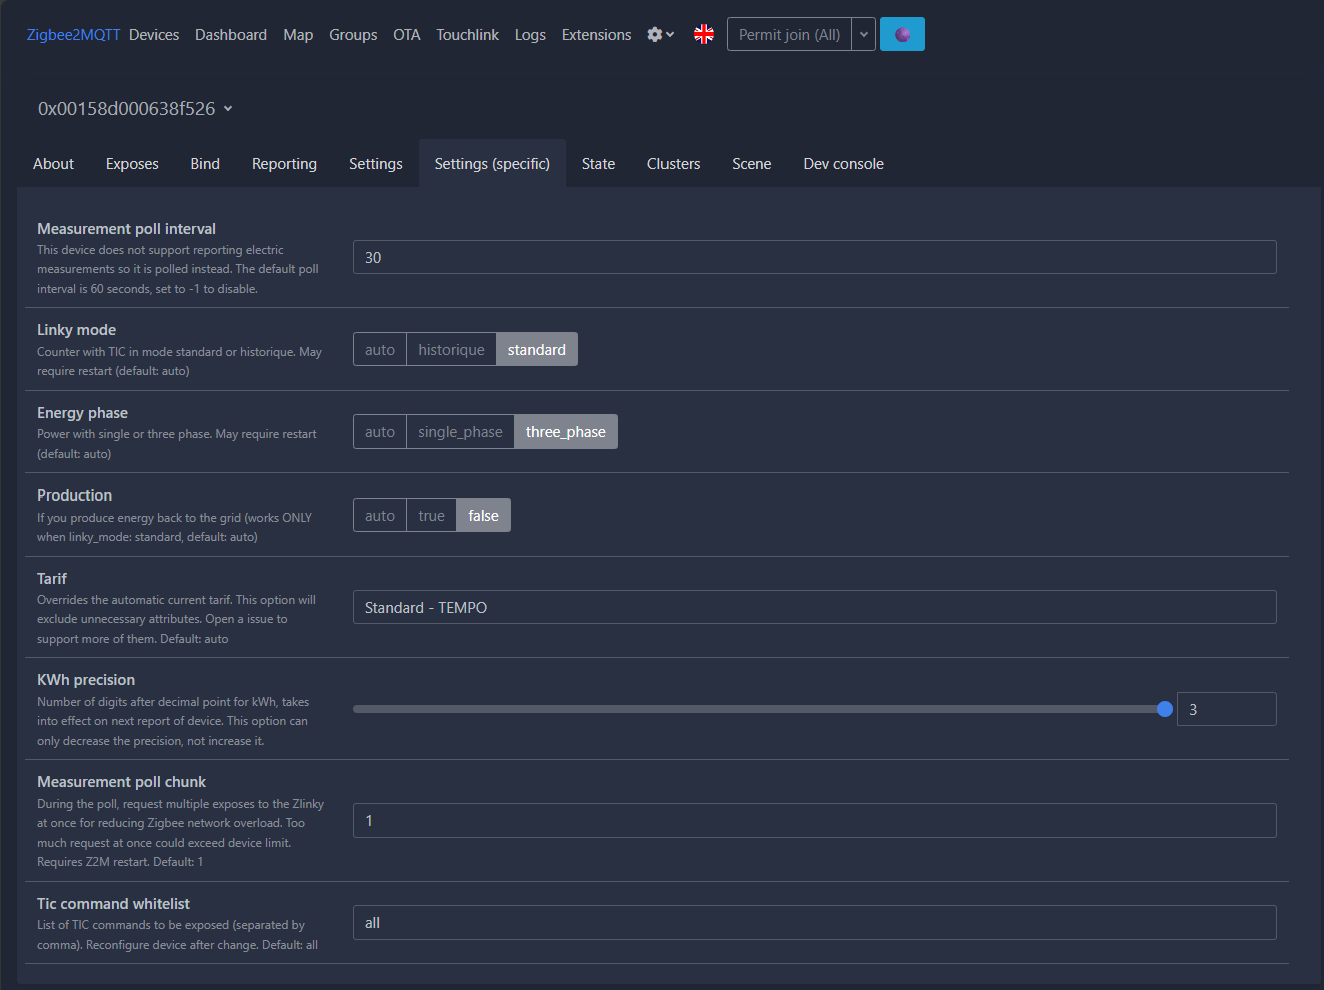
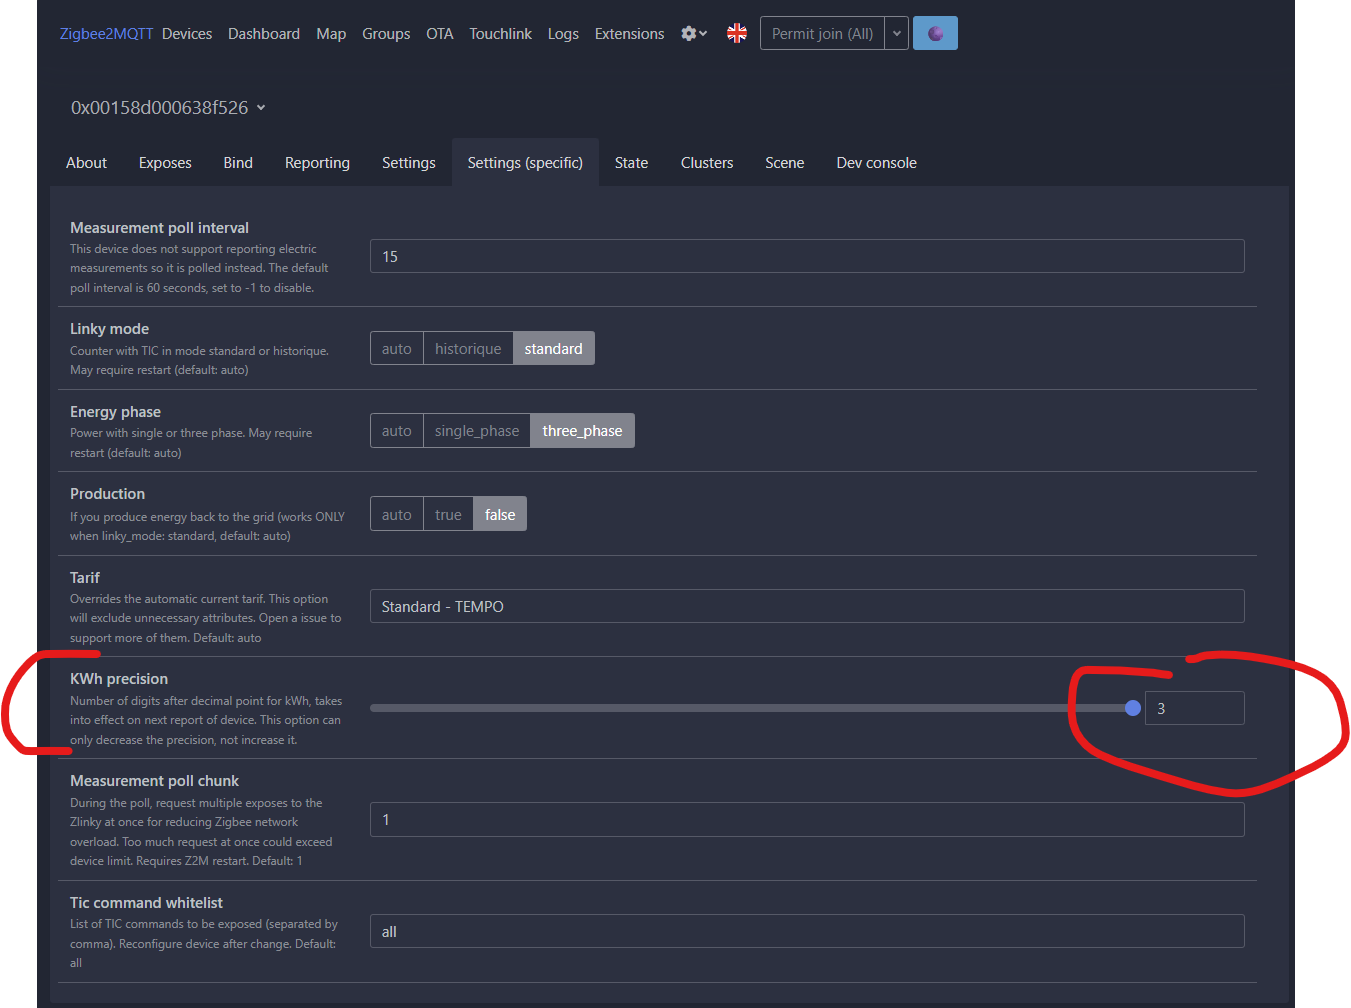
Now let’s configure the detected module in Zigbee2MQTT: information reported every 30 seconds (you can lower this a little, but avoid overloading the network and MQTT), meter in standard mode (to be checked at your home, it depends on your EDF (Electricity of France) contract), three-phase meter and installation in this house, no electricity production, TEMPO subscription.
Above all, set the KWh accuracy to 3!
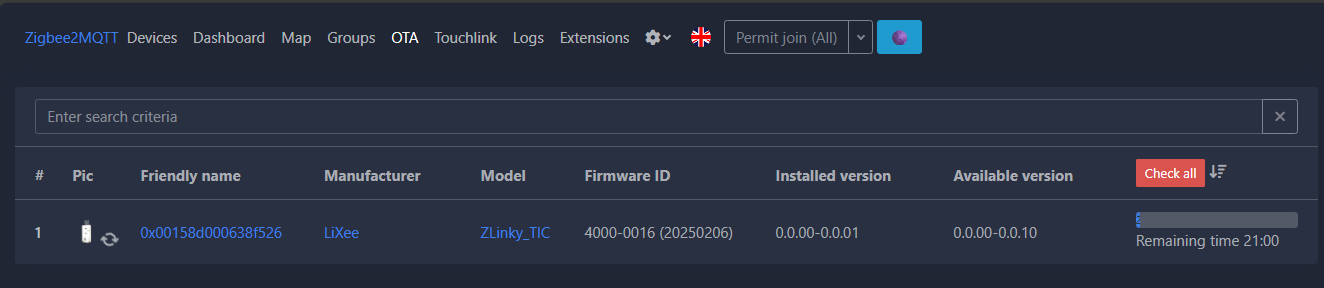
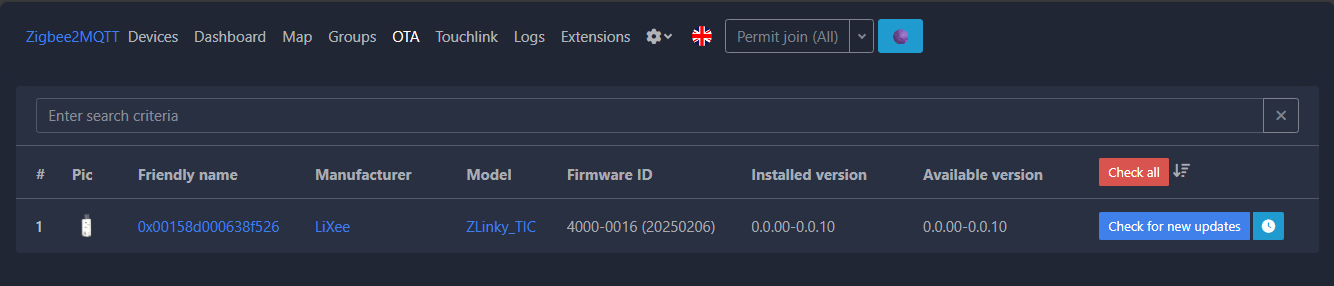
Now let’s check if an update is available in the “OTA” menu.
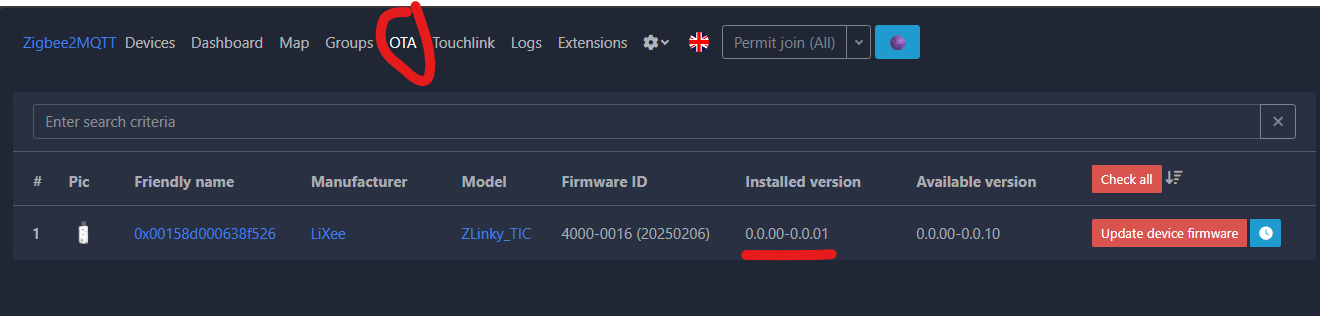
Let’s start the update.
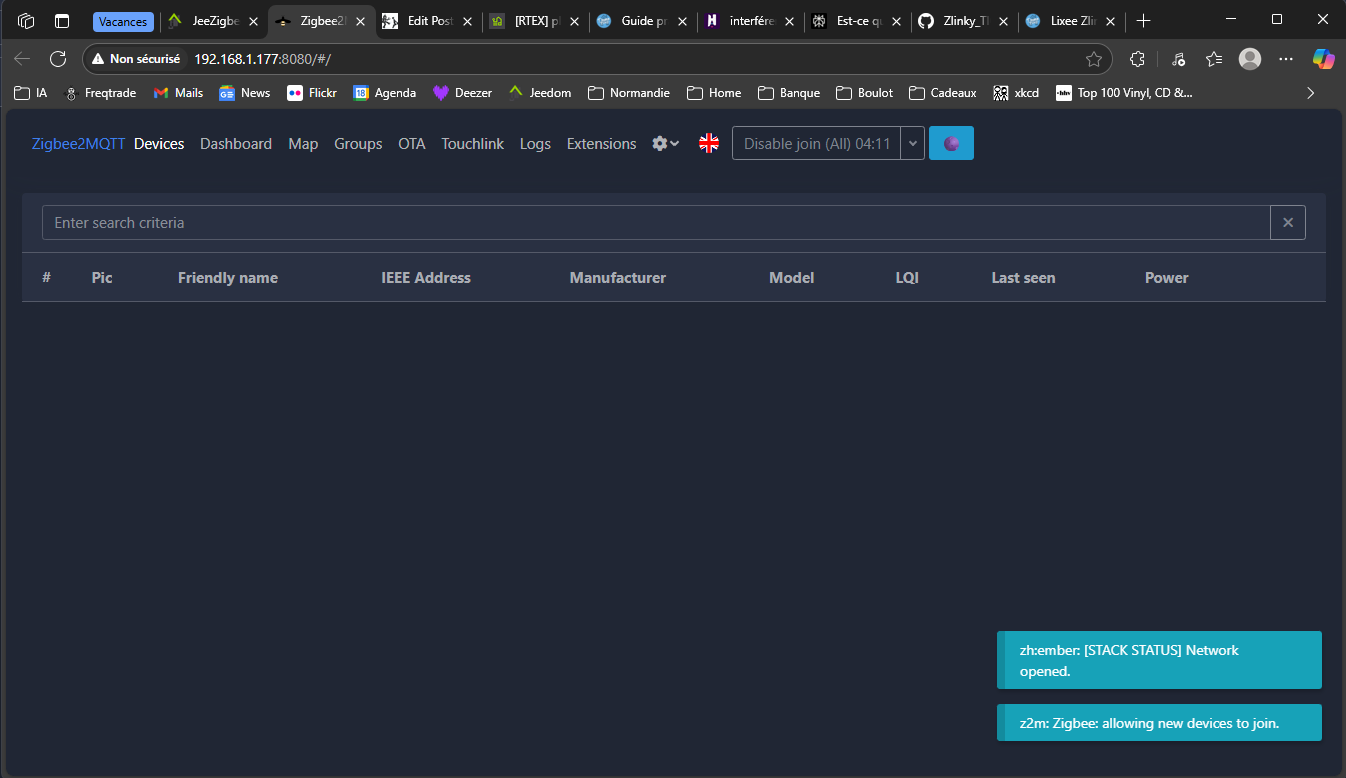
Now we return to our Jeedom, and normally a new device should have been automatically added to the Z2M plugin, thanks to the Zigbee2MQTT library sending MQTT auto-discovery messages on the “zigbee2MQTT” topic, and the retrieval of these messages by the Jeedom JeeZigbee/Z2M plugin subscribed to the “zigbee2mqtt” topic visible in the configuration.
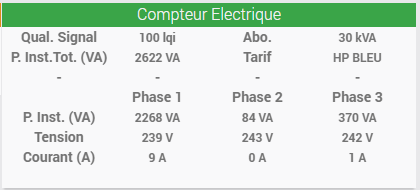
Now, we are going to look at the commands available on this new device, which we have renamed “Compteur Electrique” (important to remember for later), and which will serve as our working basis in Jeedom. These commands should correspond to the data “exposed” by the Zigbee2MQTT library and visible in its configuration interface.
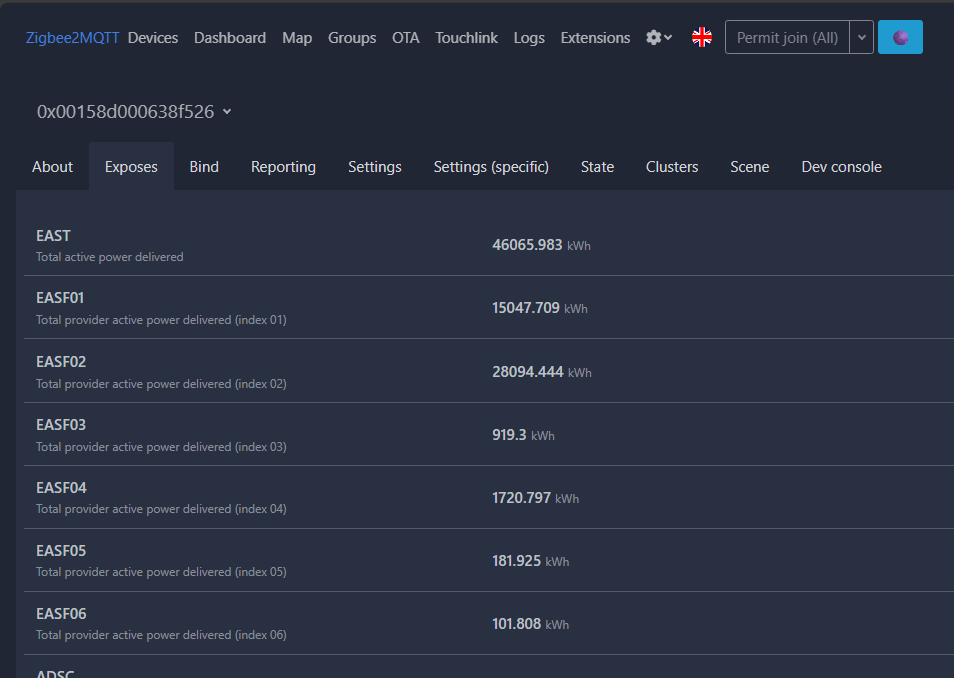
The “meters” and data match between the two interfaces, which is perfect. Now we can log the data, choose to display it on the dashboard, perform calculations on it, trigger scenarios based on its values or certain events, for example by choosing to unload certain equipment in the event of a consumption peak, or send an alert in the event of one phase being overloaded compared to the others (this installation is three-phase).
The list of exposed data is available here on the module page of the Zigbee2MQTT website.
6. Configuring a widget on the dashboard
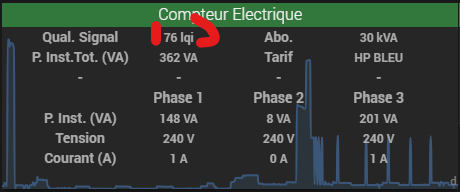
Now let’s create a simple display widget from the basic “Electricity Meter” device that was configured by Jeedom’s JeeZigbee/Z2M plugin. This widget will be used to display:
- The quality of the Zigbee connection,
- Total subscribed/permissible power,
- The current rate (peak hours, off-peak hours, etc.),
- Total instantaneous power (in Volt-Amperes (VA)),
- For each phase: its instantaneous power (VA), voltage (V), and current delivered (A)
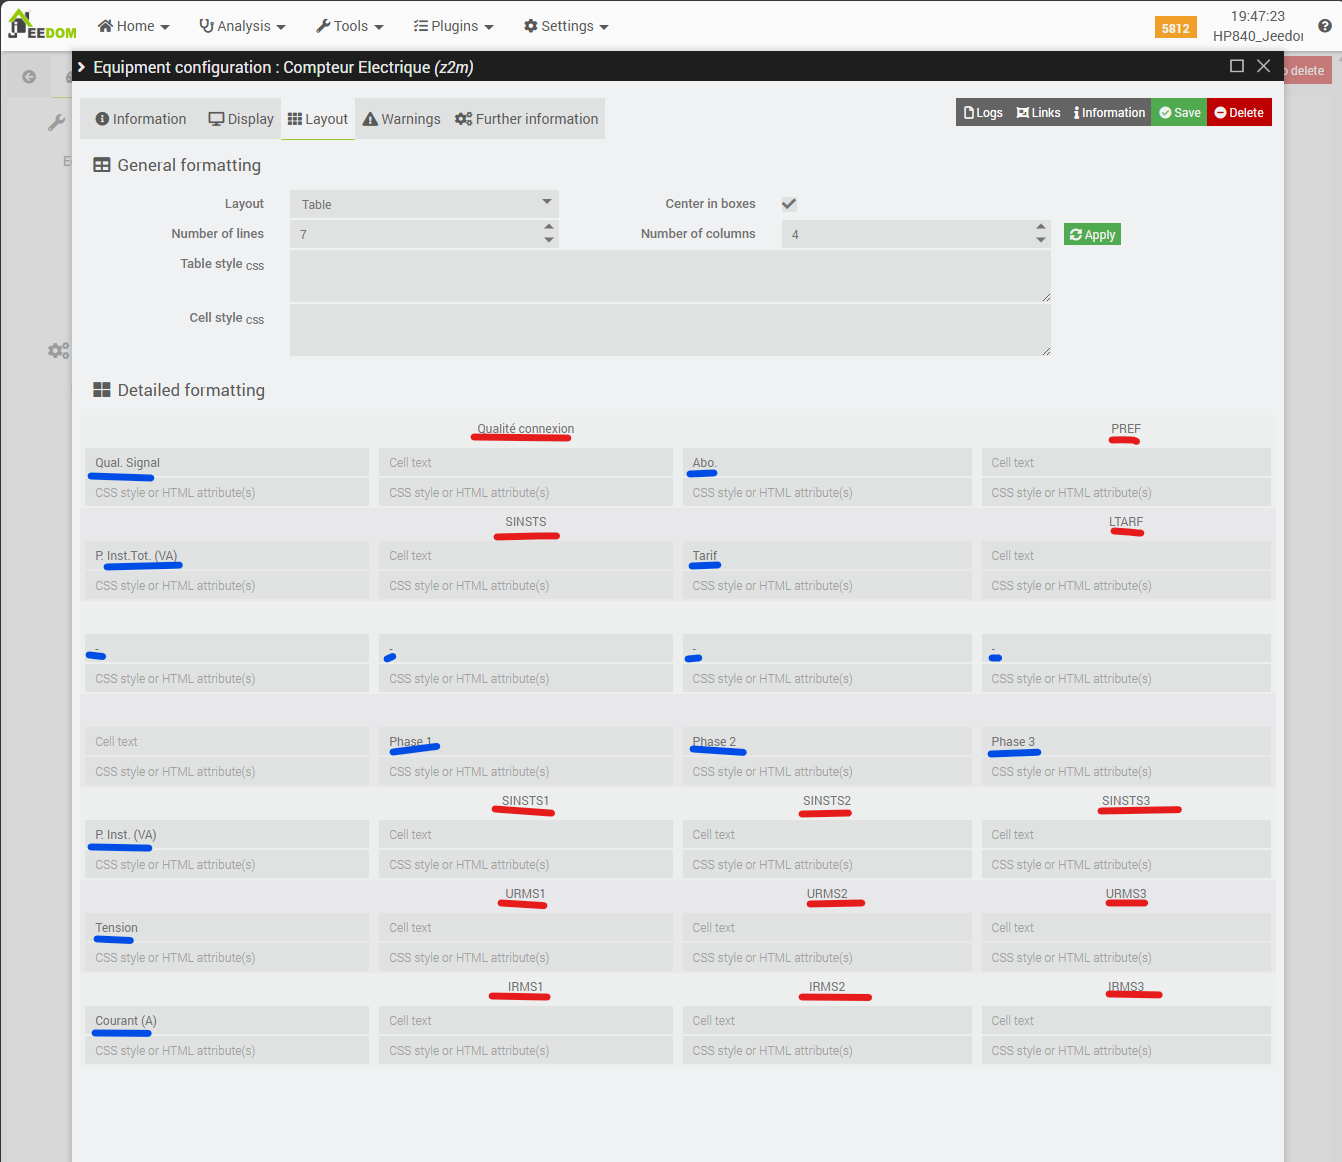
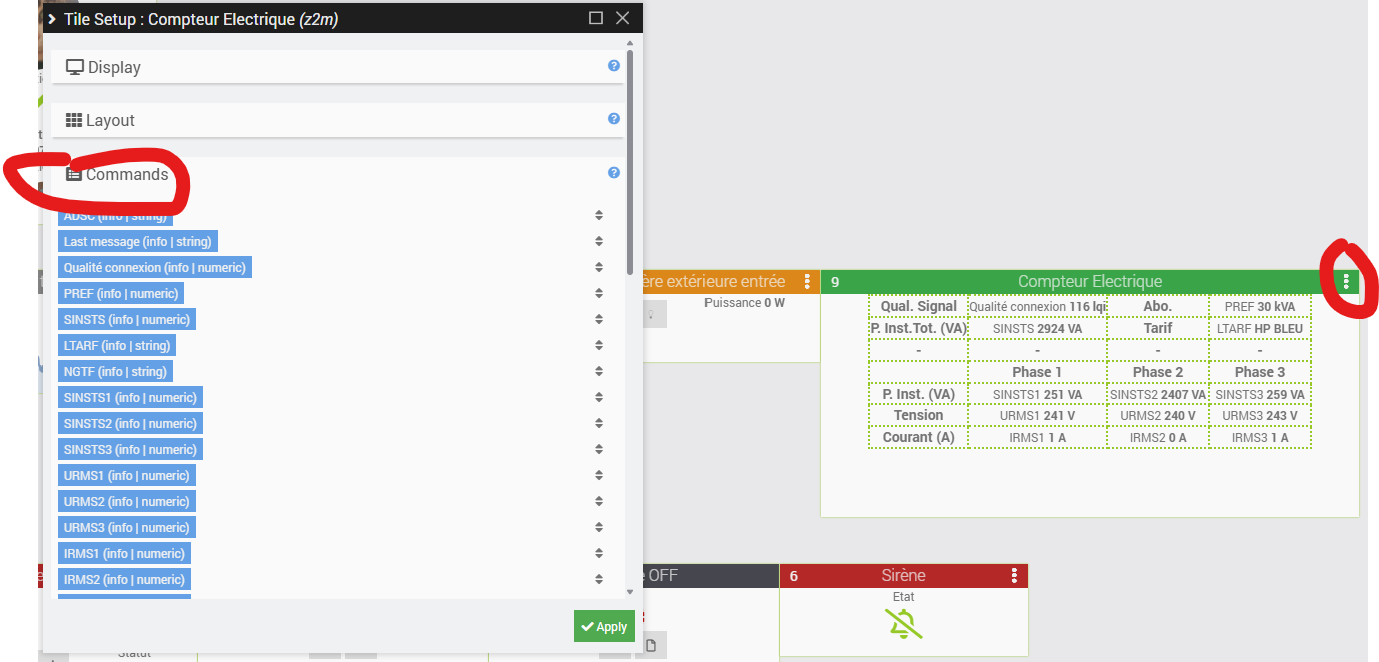
To do this, we first need to select which information we want to display on the widget. This is done in the equipment configuration, under the “Commands” tab.
Next, we will configure the display mode for this equipment’s widget using the “Advanced Setup” button at the top right of the previous screenshot: we will define a table-type display and assign either the information to be displayed or text to introduce the displayed information to the various cells.
Don’t forget to save, and now let’s see what it looks like on the Jeedom dashboard…
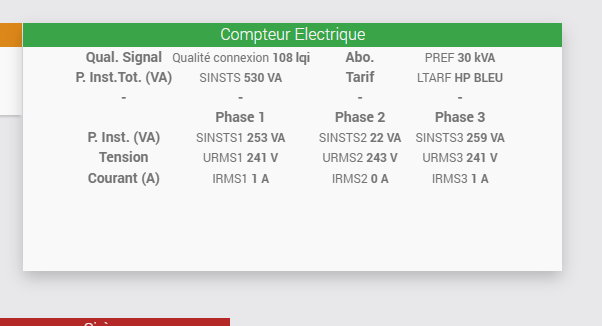
We can see here that the layout isn’t great yet, but that’s normal—we still have a little configuration to do. This time, it’s done directly in the “edit” mode of the main Jeedom dashboard, accessible via the small pencil icon at the top right.
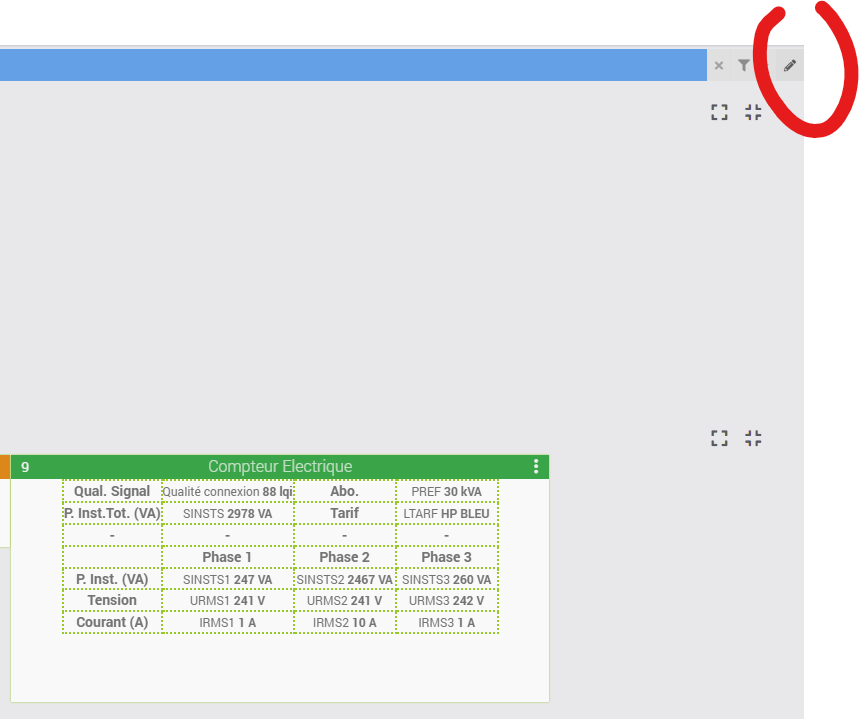
Edit mode is indicated by the blue banner at the top of the screen and by the three small vertical dots that appear at the top right of each widget on the dashboard. These widgets can also be resized and moved around on the dashboard. Click on the three small dots.
We will now configure the commands we have chosen to display, to hide their names and keep only their values. It’s very simple. Let’s take the example of the first command, “Connection quality.” Just uncheck “Show name” and then click “Apply.”
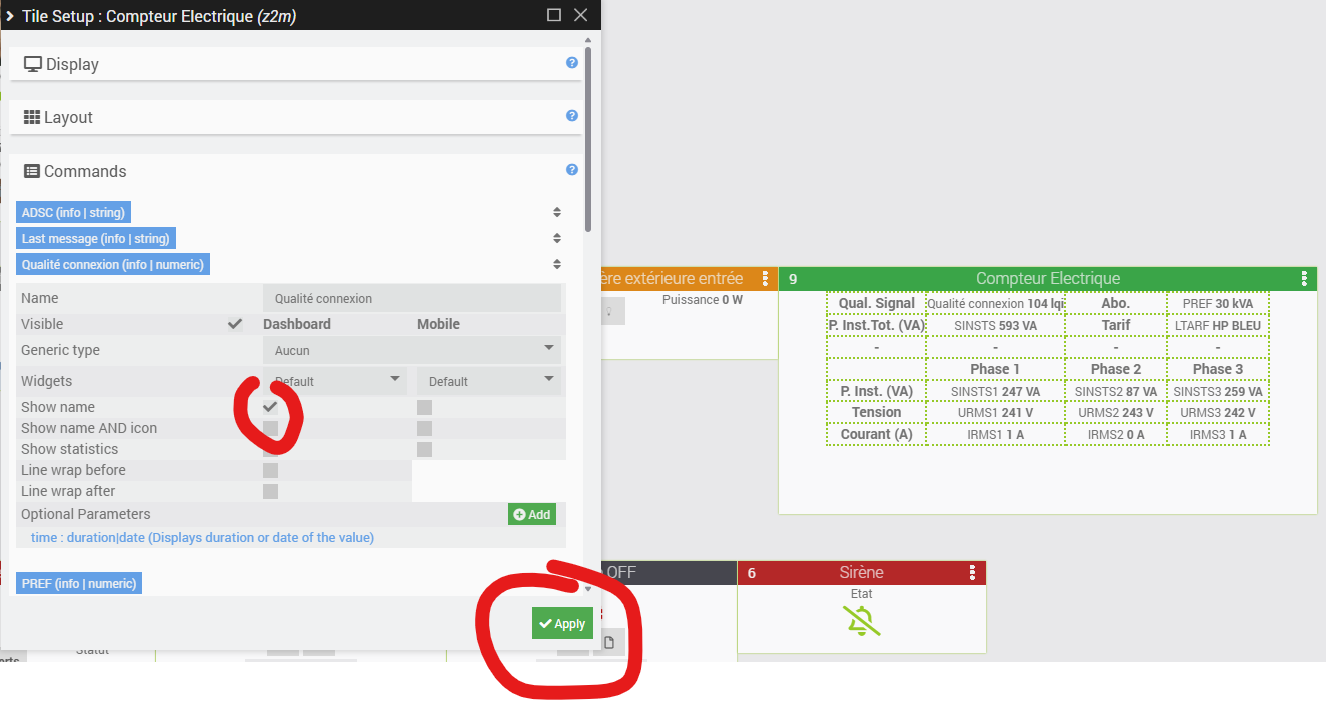
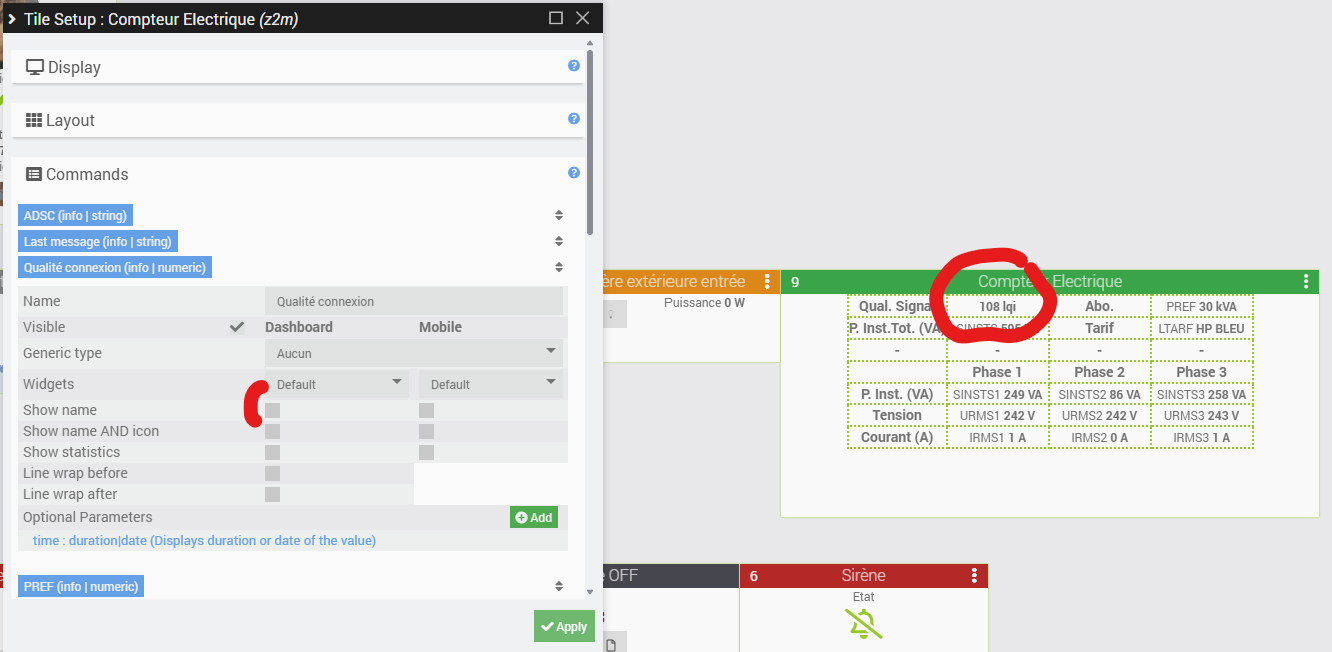
All you have to do now is repeat the same process for the other information displayed by the widget, and that’s it! Close the configuration pop-up, resize the widget if necessary, and click on the pencil icon in the top right corner again to save the layout and exit edit mode.
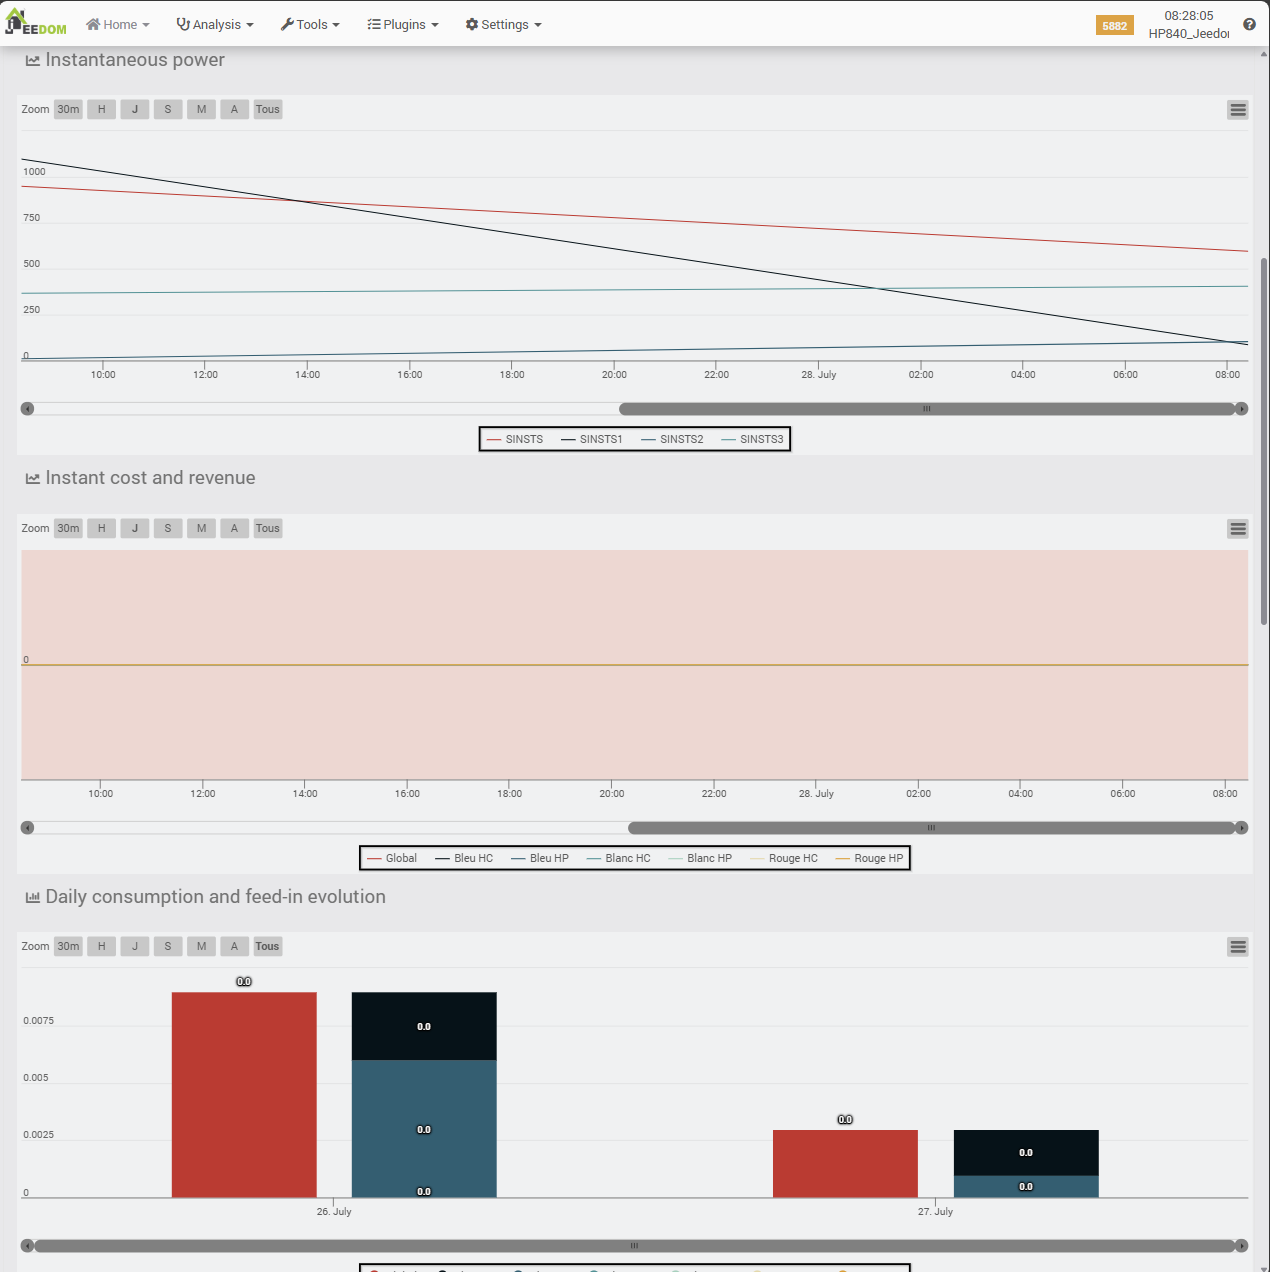
One last little refinement to finish off this section… We are going to display the general curve of the power delivered by the electricity meter in the background of the widget, to get a quick overview of any peaks. Let’s go back to the Zigbee module configuration, and its advanced configuration, but this time to the “Display” tab.

We choose to display SINSTS information for a period of one day in curve mode.
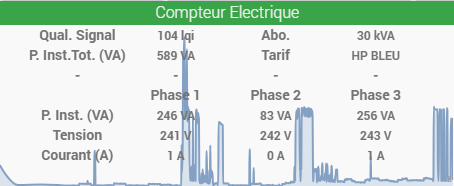
Please note that since we have also chosen to archive certain data, in addition to displaying it, some of the data displayed can be “clicked” to view its history.
7. Using the Teleinfo plugin
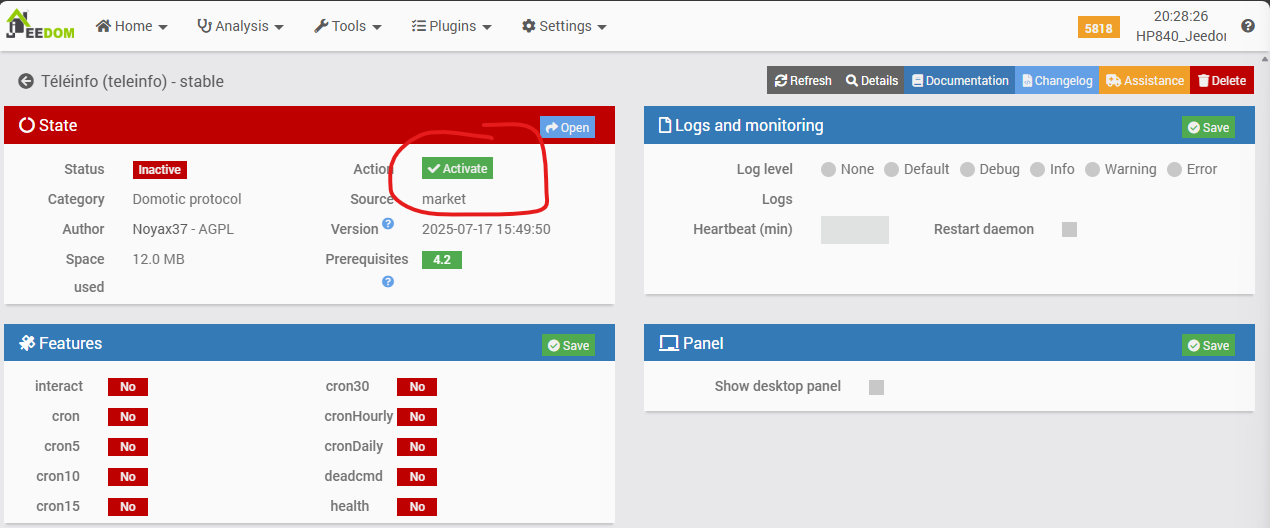
7a. Installation from the marketplace
Next step: use this free plugin, which will let us keep a history of consumption data, run statistics based on different time brackets (peak hours, off-peak hours, etc.), compare last year’s usage with this year’s (note: the plugin can only generate statistics from the data it has actually “seen” go by—it can’t guess anything), estimate costs, and much more.
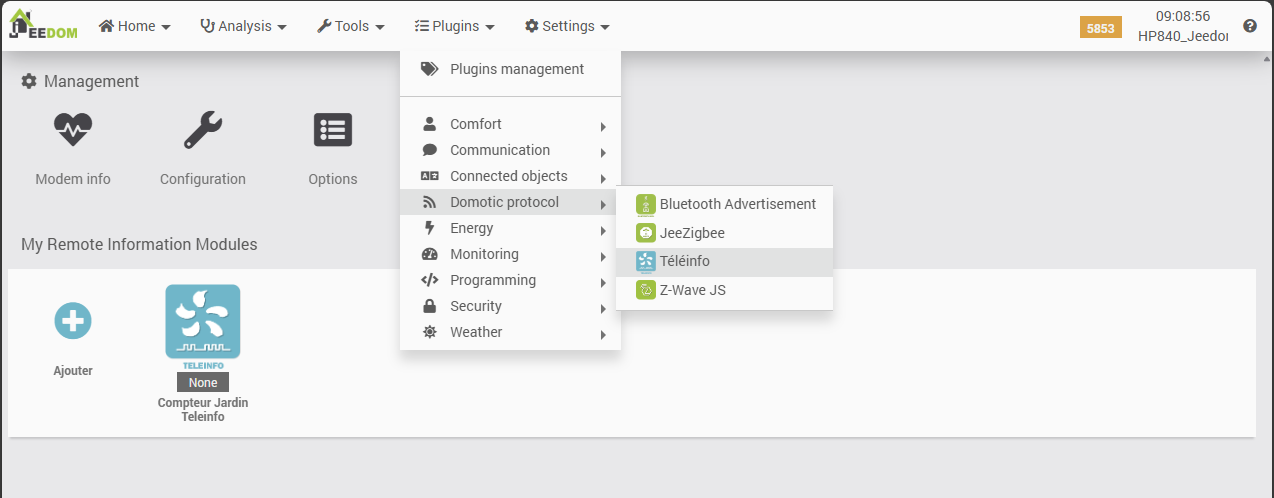
Head to the marketplace to get the plugin, and open its documentation.
7b. Manual creation of Teleinfo equipment
The method I am about to describe is not the standard documented method (see appendices at the end of the article). This plugin is normally capable of “feeding” itself from ENEDIS TELEINFO format data retrieved either by a Teleinfo TIC modem connected via USB (see previous article on the subject with such a modem) or from data still in ENEDIS’s standard TELEINFO format, but arriving via a queue of MQTT messages.
Problem: the ZLinky module we use in this article for “long-distance” Zigbee transmission and the Zigbee2MQTT library do not format MQTT messages in the standard TELEINFO format, which means that the TELEINFO plugin cannot detect the information reported by the module on its own. It therefore does not automatically create a “teleinfo meter” device from the information received, and consequently cannot automatically update its own consumption values received and required for its operations.
However, because this plugin provides a very useful dashboard, we will definitely try to use it, but:
- By creating the meter and its controls manually => workaround for the issue of non-standard MQTT messages that prevent the TELEINFO plugin from detecting our electricity meter on its own and creating its “Teleinfo” meter version.
- By feeding the commands to the new “Teleinfo” meter from a fairly basic scenario that we are going to configure => bypassing another problem with the Zlinky module seen by Zigbee2MQTT, which is to report consumption values in kWh rather than Wh as expected by the Teleinfo plugin.
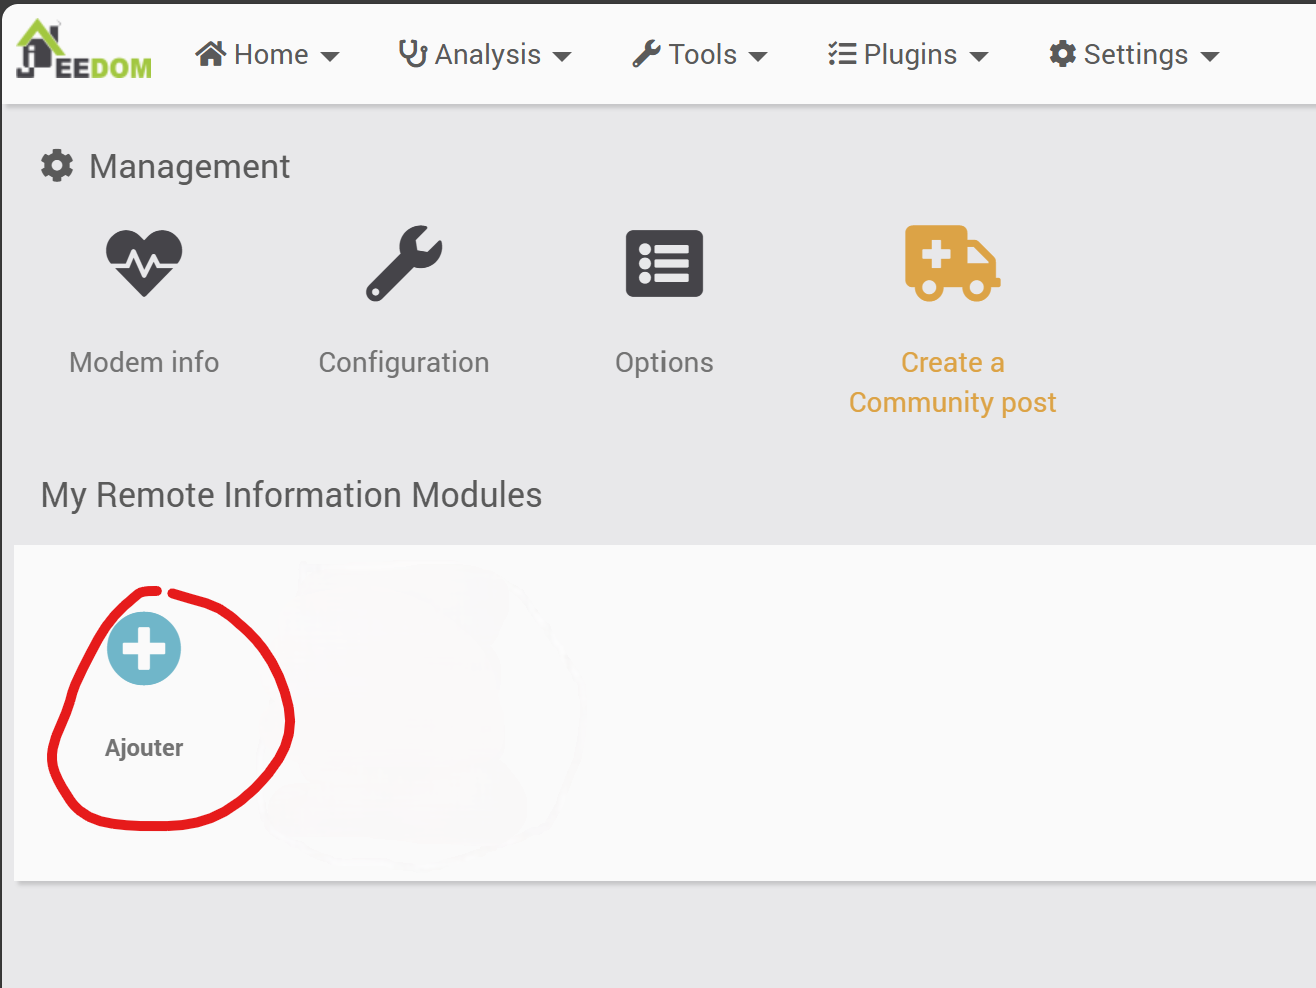
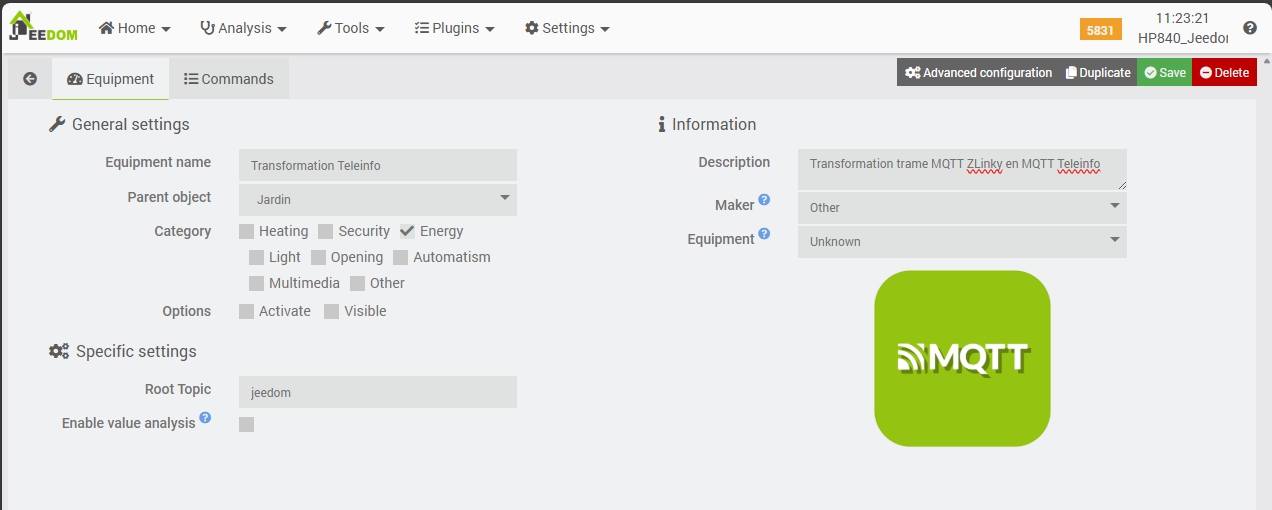
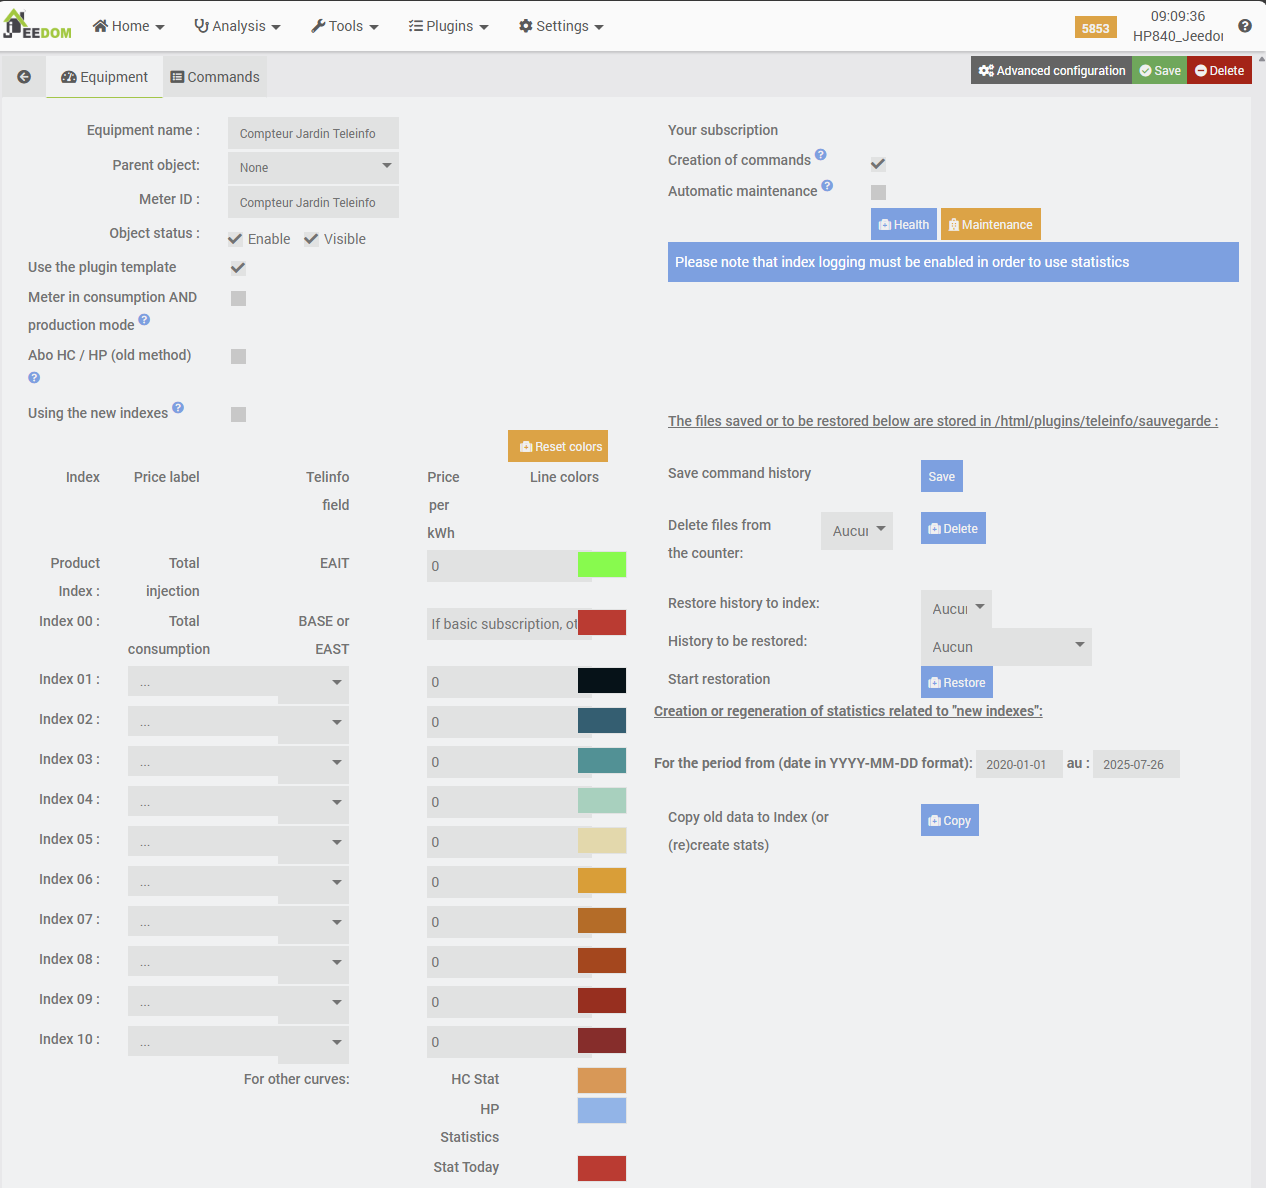
Let’s start by manually creating a new counter in the Teleinfo plugin.
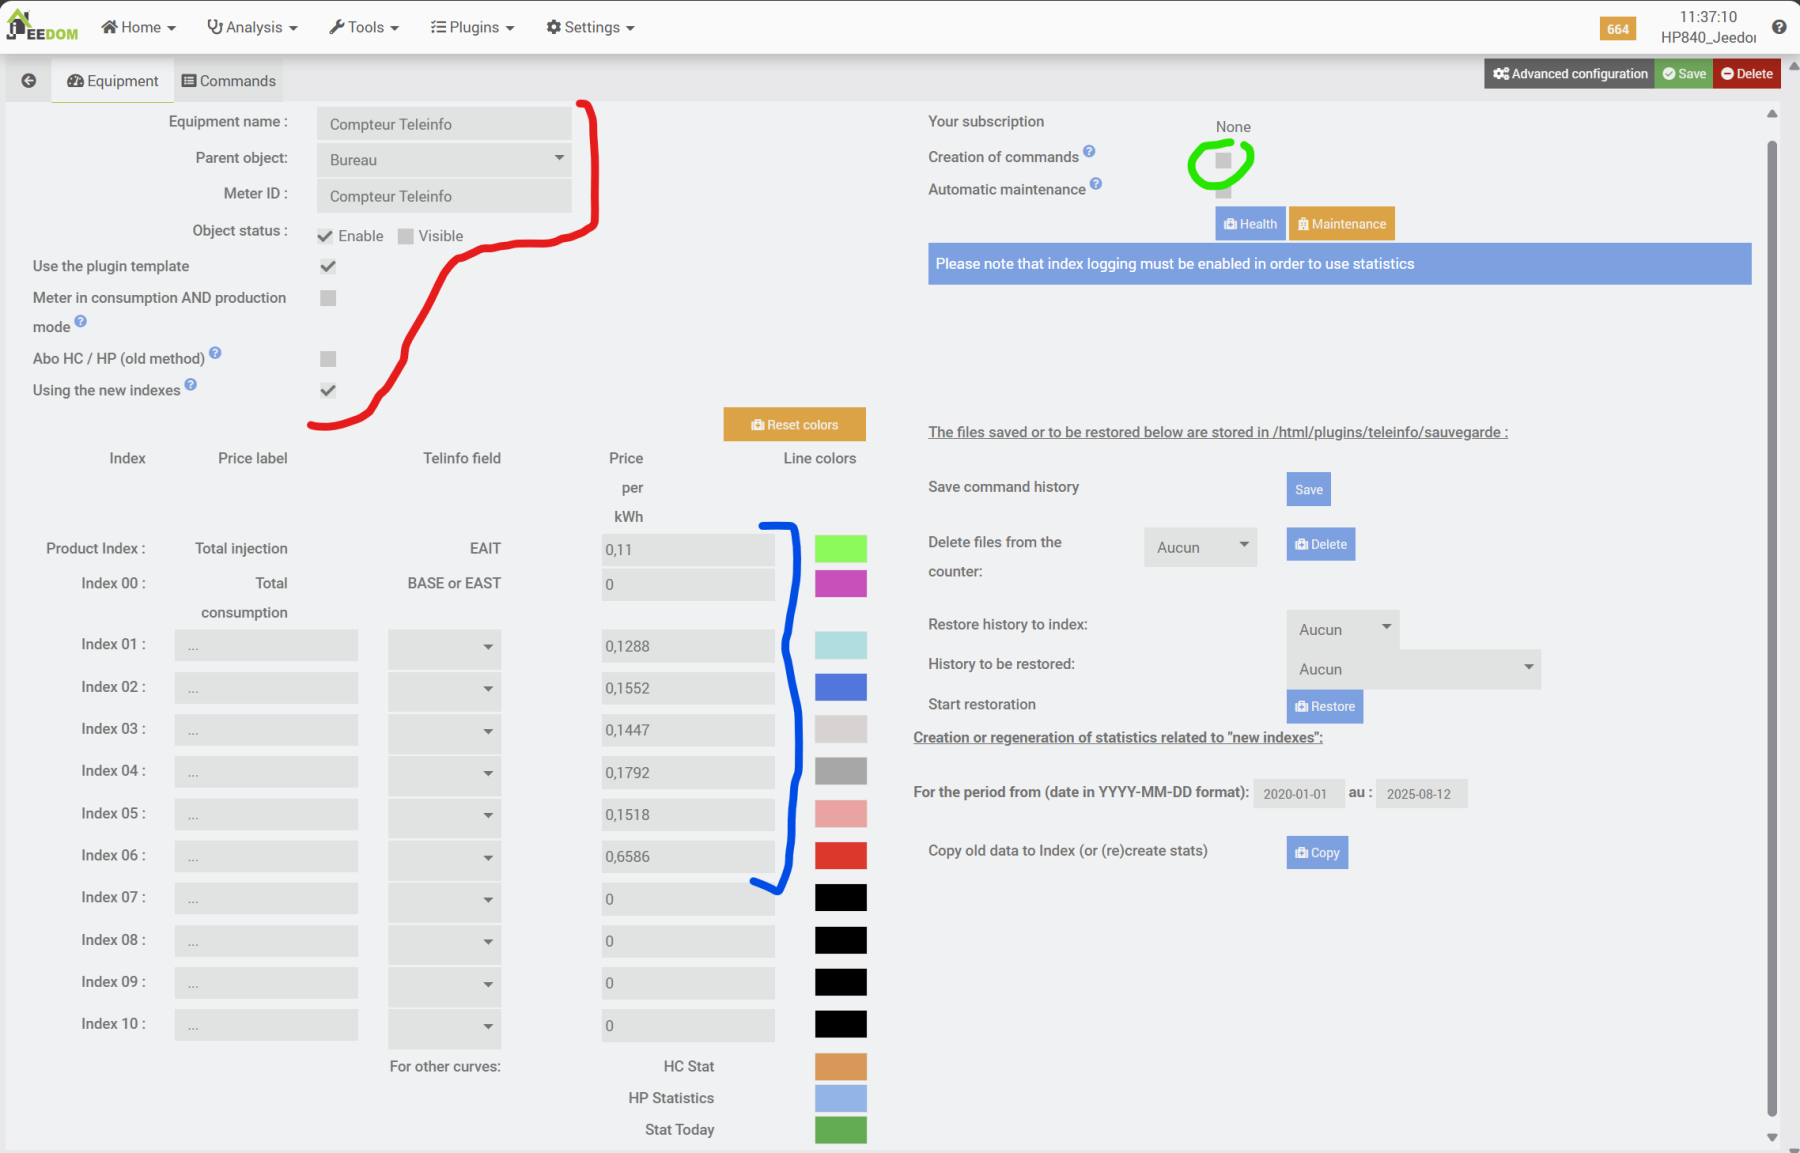
Note that you can use any name and ID you want (shown in red in the previous screenshot); however, if the plugin were designed to be powered by a USB modem or MQTT messages, the ID here would correspond to the one that appears in the frames read. Similarly, we do not need to check the box for automatic command creation (in green).
I named this new piece of equipment “Compteur Teleinfo” (French for “Teleinfo Meter”) and placed it in the “Office” room, to easily distinguish it from the “Electricity Meter” located in the “Garden.”
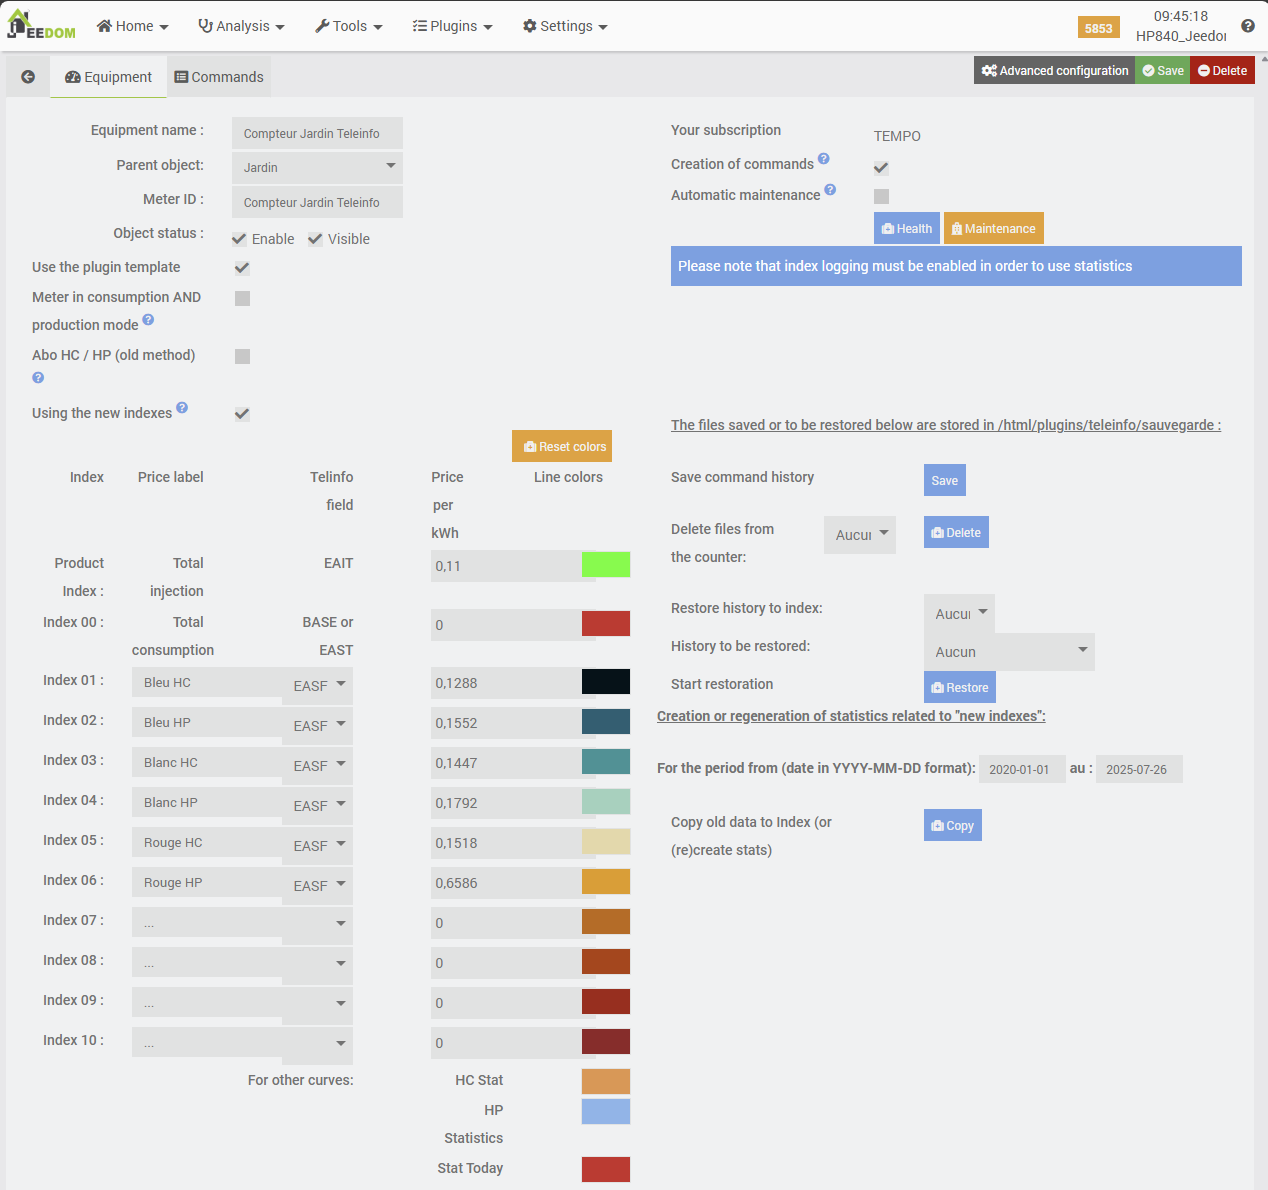
Please also note that I have highlighted (in blue) the actual cost per kilowatt-hour in euros, based on my subscription (in this case, an EDF TEMPO subscription).
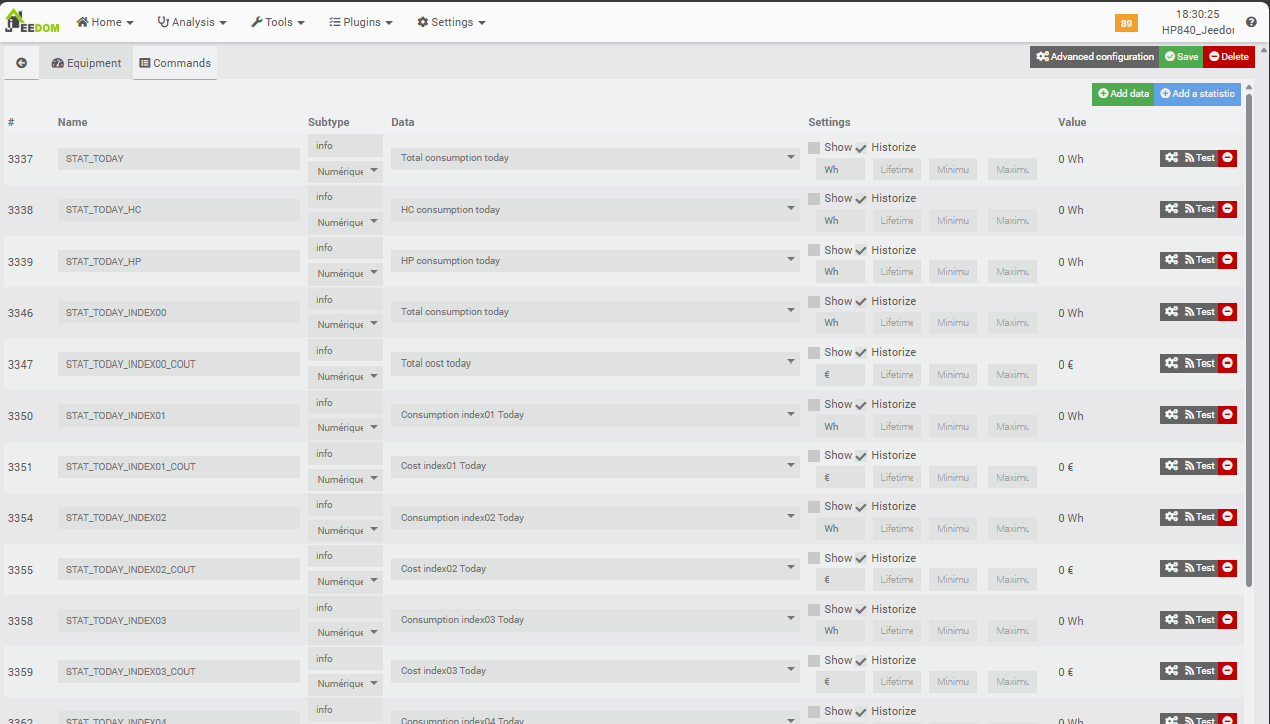
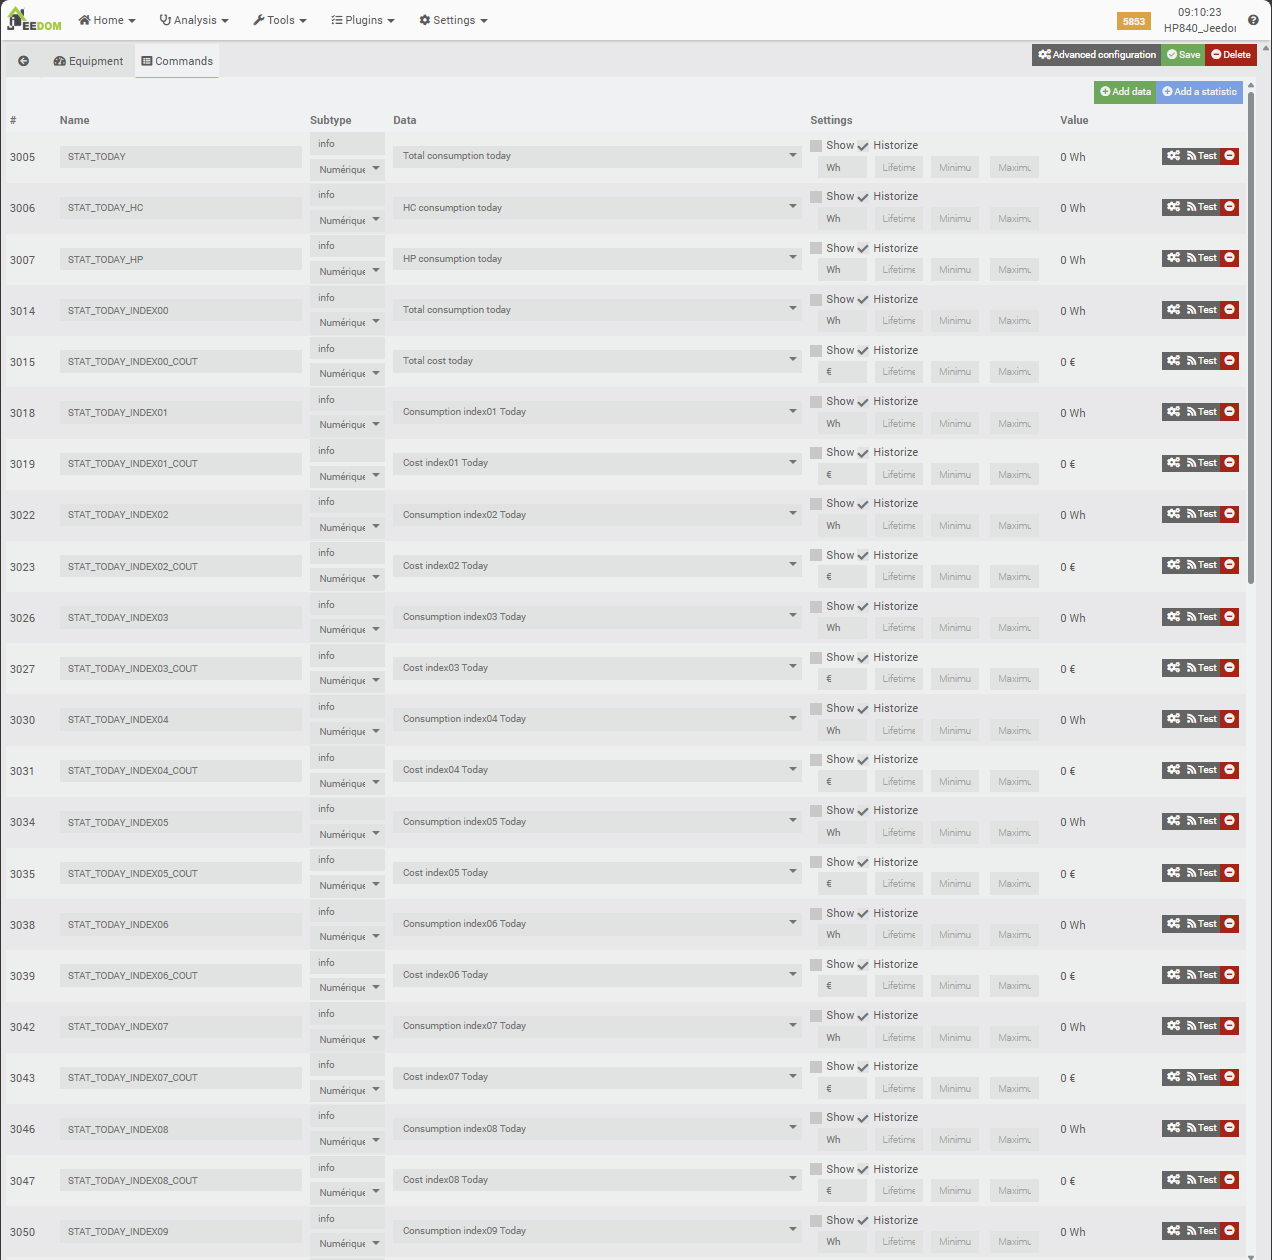
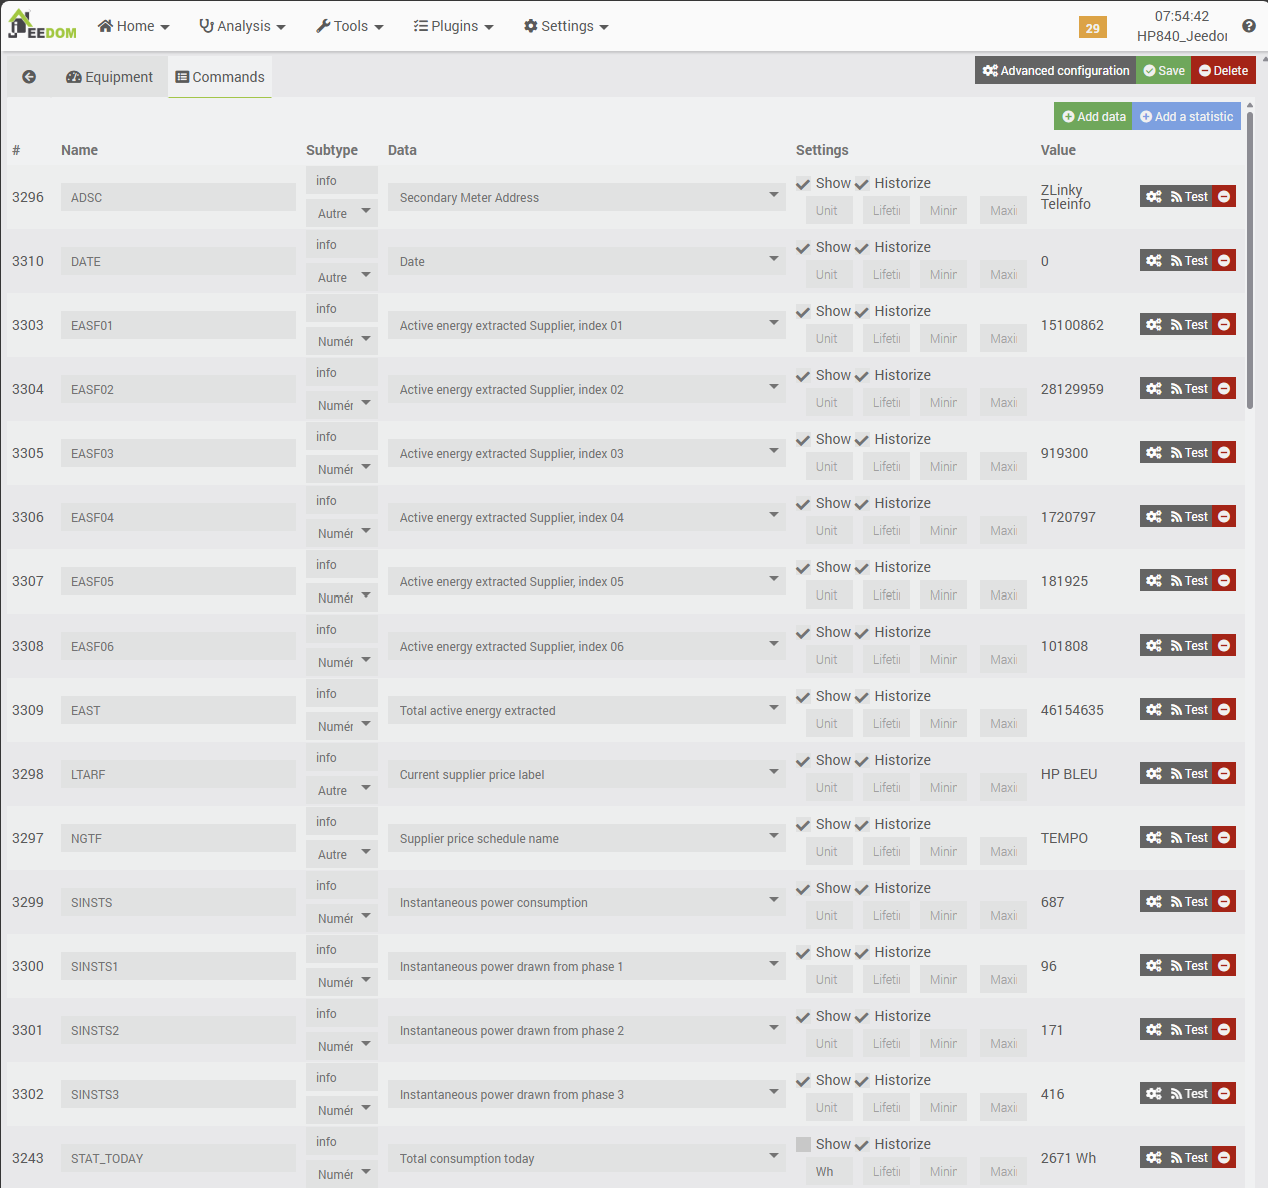
Save, then go to the commands tab. You will see that a large number of commands are already present. These are used to record values and generate statistics. They will be used and displayed by the plugin dashboard, and calculated by operations that are performed automatically and regularly, based on consumption data collected from the various indexes that the plugin normally reads in MQTT or via USB, but which we will have to manually feed back to the plugin here.

7c. Manual creation of consumption meters/commands
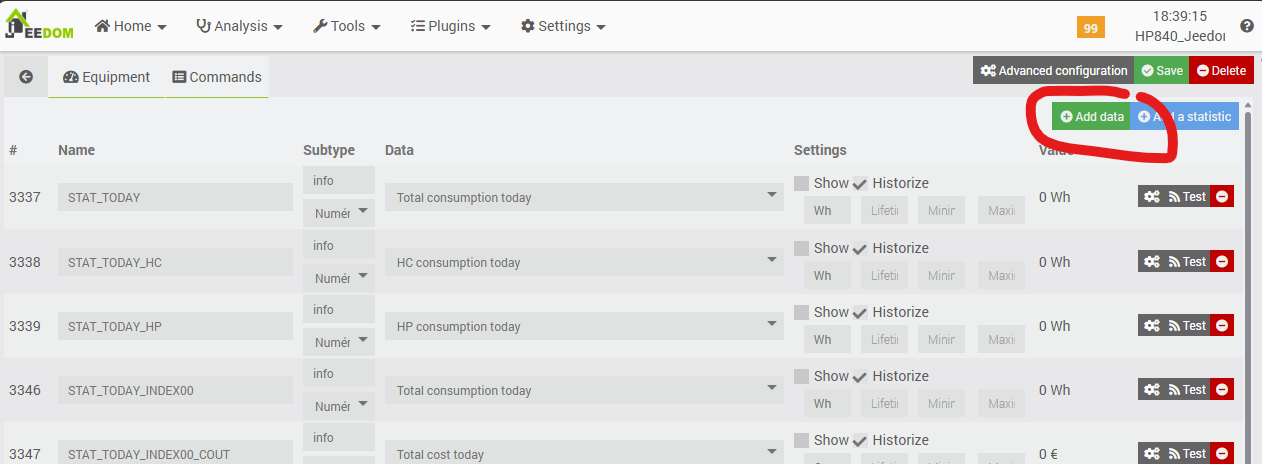
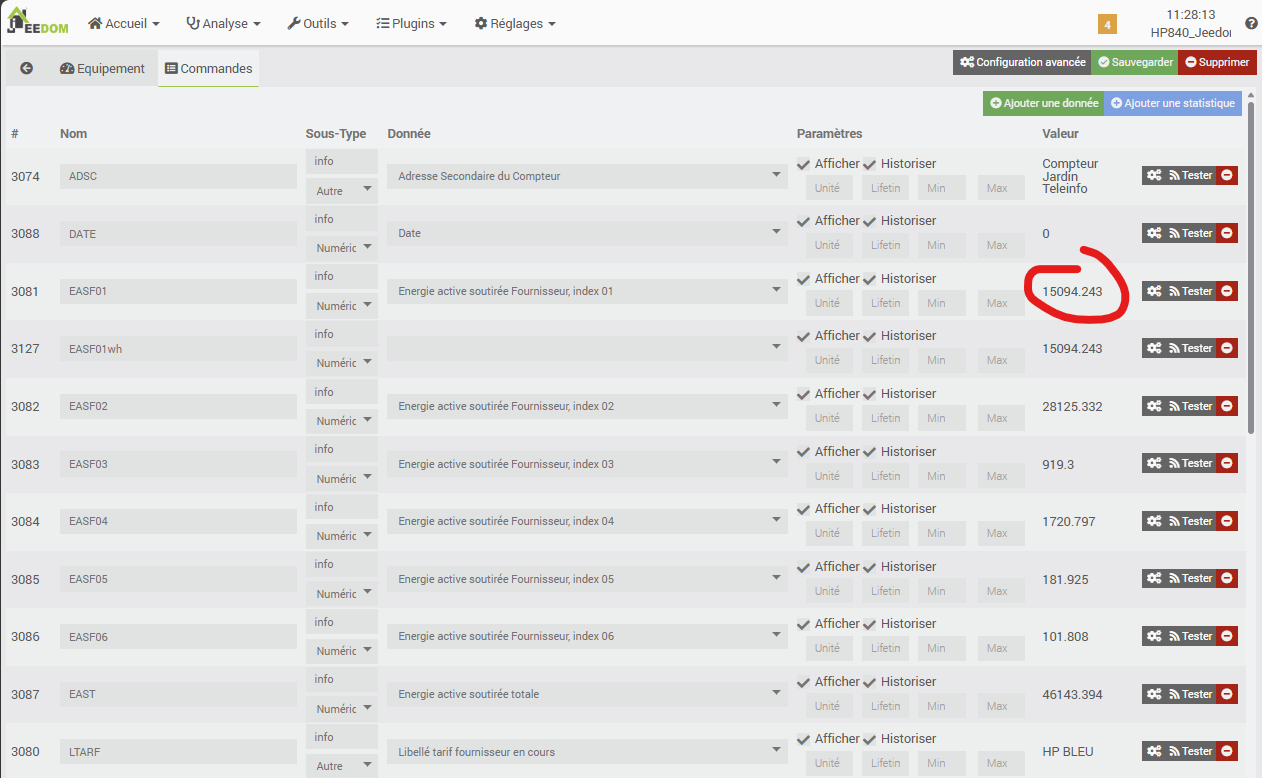
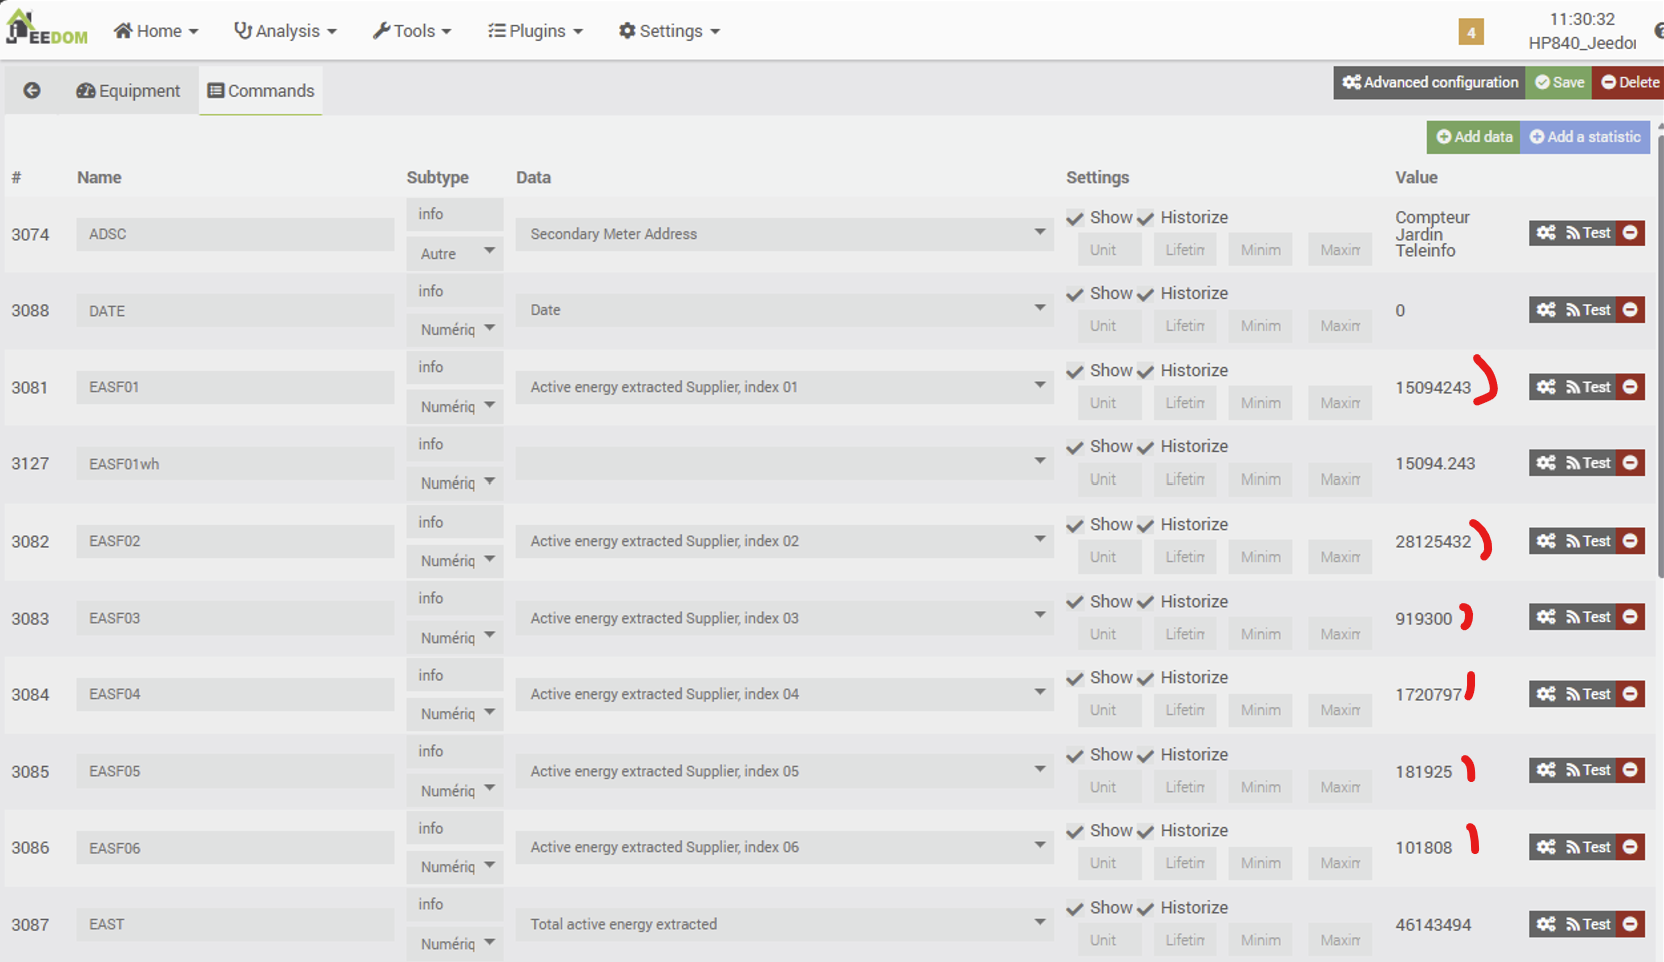
As we have seen, commands are created automatically, but not those that allow the plugin to be fed with consumption data from our JeeZigbee “Electricity Meter” device. We will first add these commands.
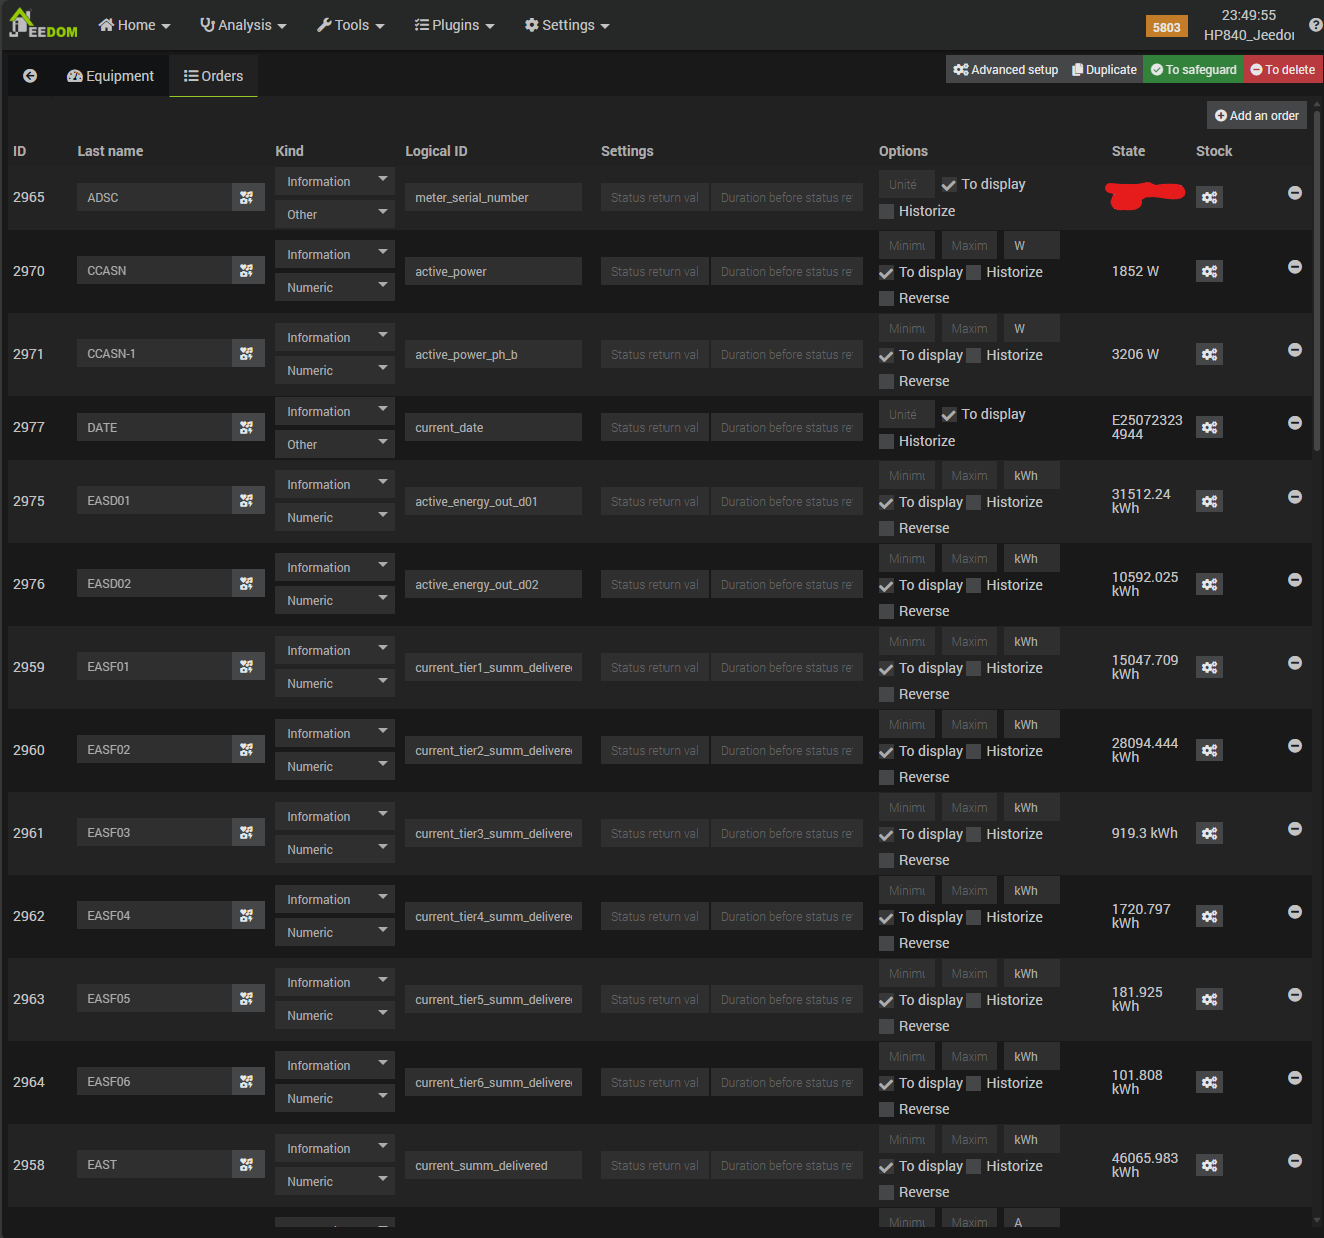
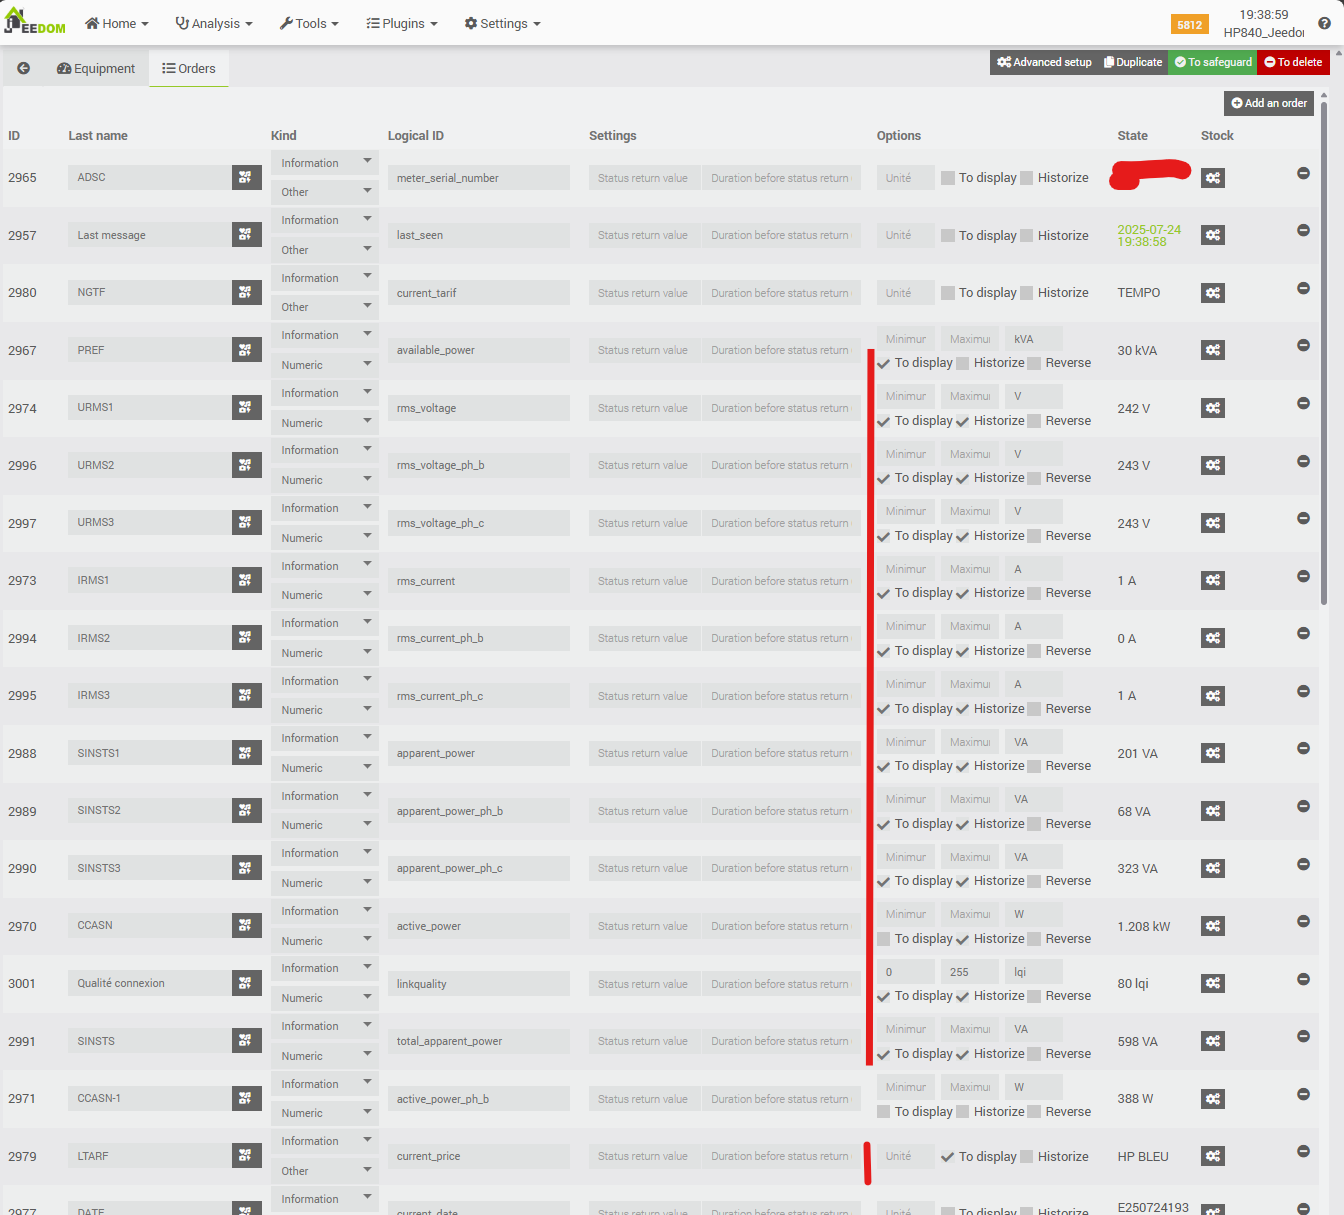
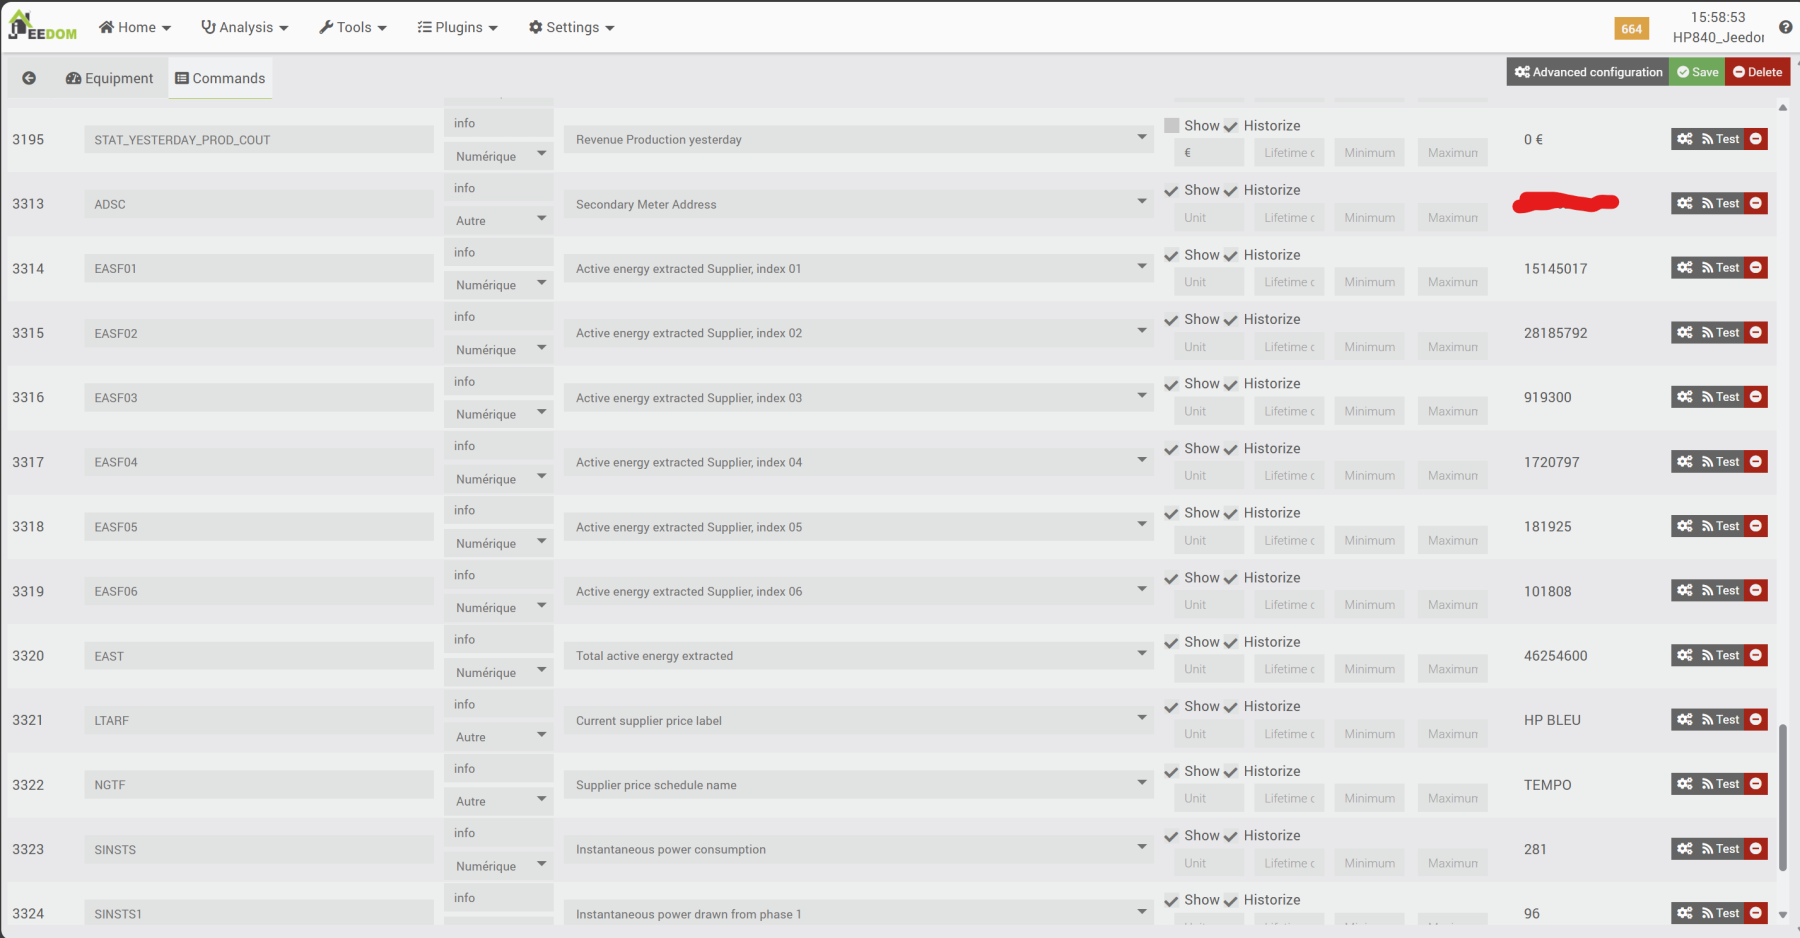
What data do we need? The meter ID, which is always useful (ADSC data in standard TELEINFO frame), consumption by index (EASF01 to EASF06 data in our TEMPO subscription case), total consumption (EAST), the type of subscription taken out (NGTF), the current pricing for the subscription taken out (LTARF), and the current “debited” on each phase and in total (SINSTS1 to 3 and SINSTS). That is 14 pieces of data, so 14 commands to be created in the Teleinfo meter.
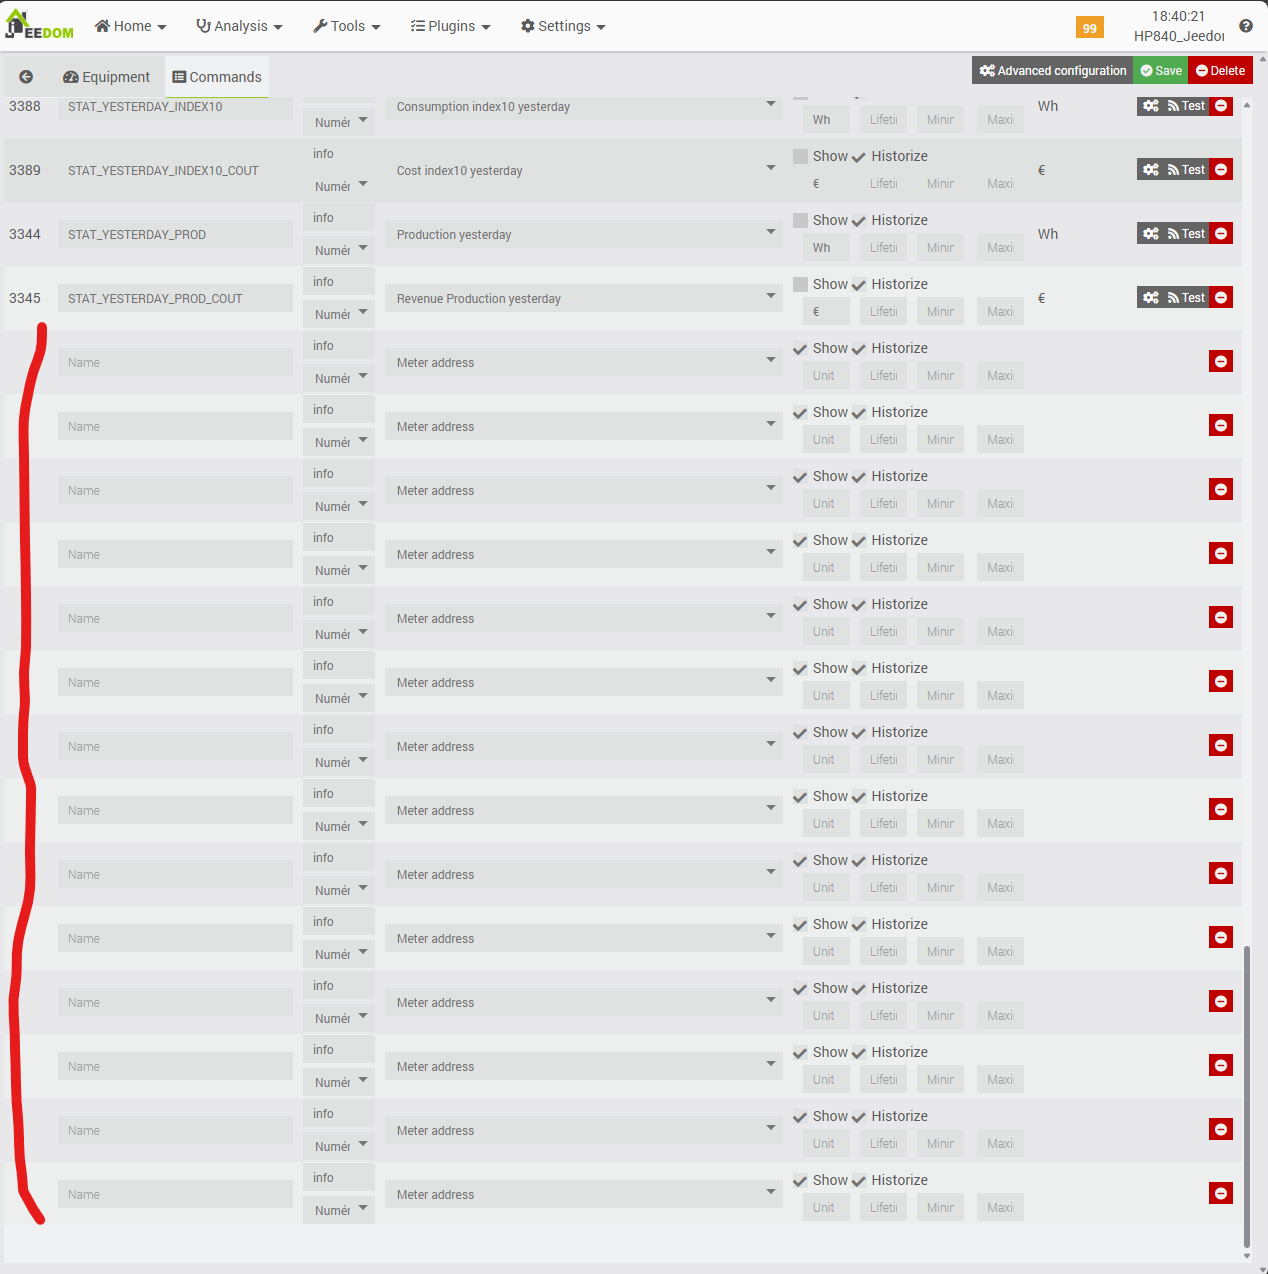
We will name each of the new commands using the name of the field normally received in the TELEINFO frame, and in the “Data” column we will indicate what type of data it is, so that the plugin knows what to do with it.
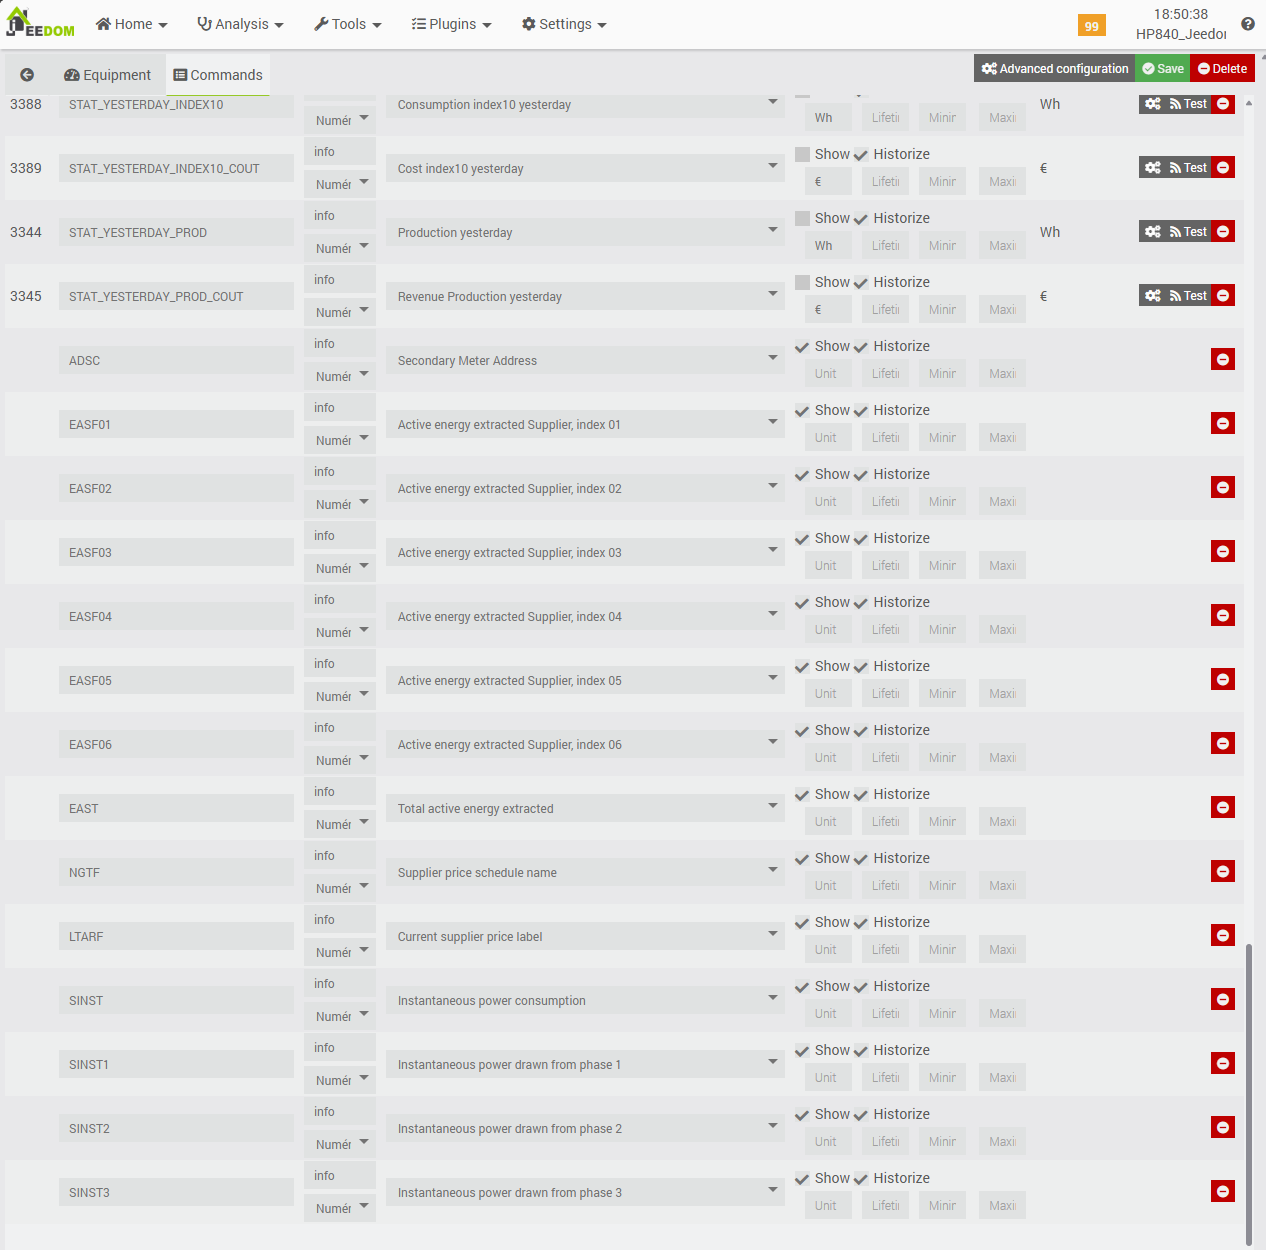
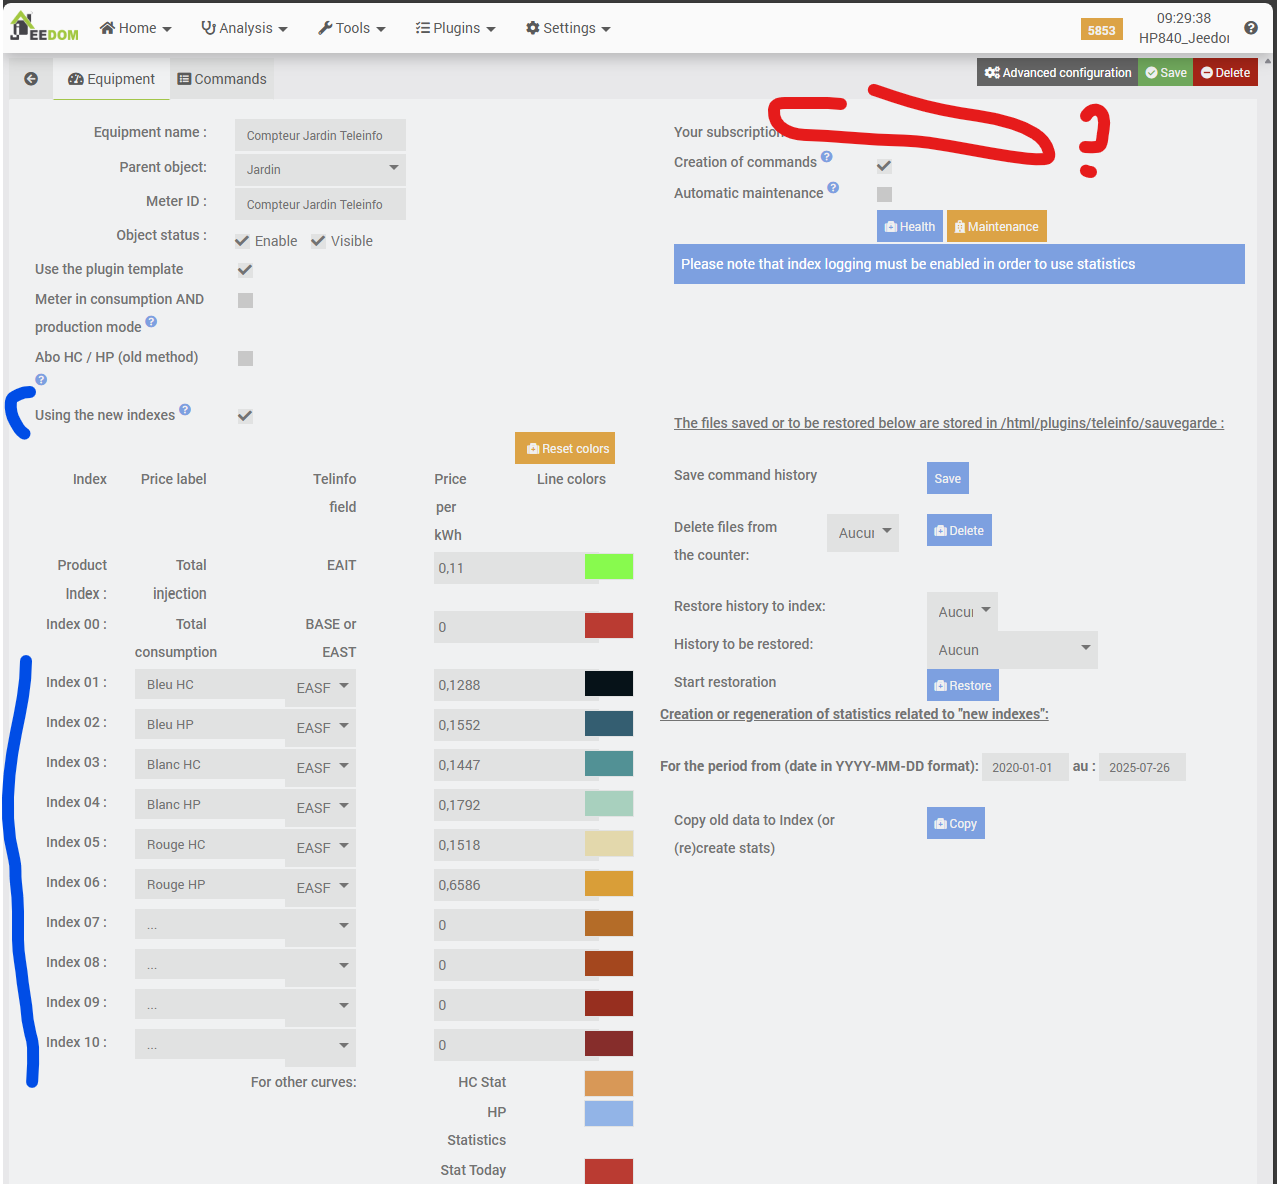
Let’s go back to the “Equipment” tab to match the consumption commands to the Teleinfo INDEXES we want to use for the plugin’s calculations. The naming of the indexes and their association with the commands created previously depends once again on the type of subscription you have with your energy supplier.
- Off-peak hours at BLUE rate = index/order EASF01
- Peak hours at BLUE rate = index/order EASF02
- Off-peak hours at WHITE rate = index/order EASF03
- Peak hours at WHITE rate = index/order EASF04
- Off-peak hours at RED rate = index/order EASF05
- Peak hours at RED rate = index/order EASF06

7d. ZLinky JeeZigbee to Teleinfo feeding scenario
Our “Teleinfo Meter” device from the Teleinfo plugin is now configured, so all that remains is to feed it data. To do this, we will create a scenario that will dynamically update the commands we have just created, based on data from the JeeZigbee/Z2M ZLinky device.
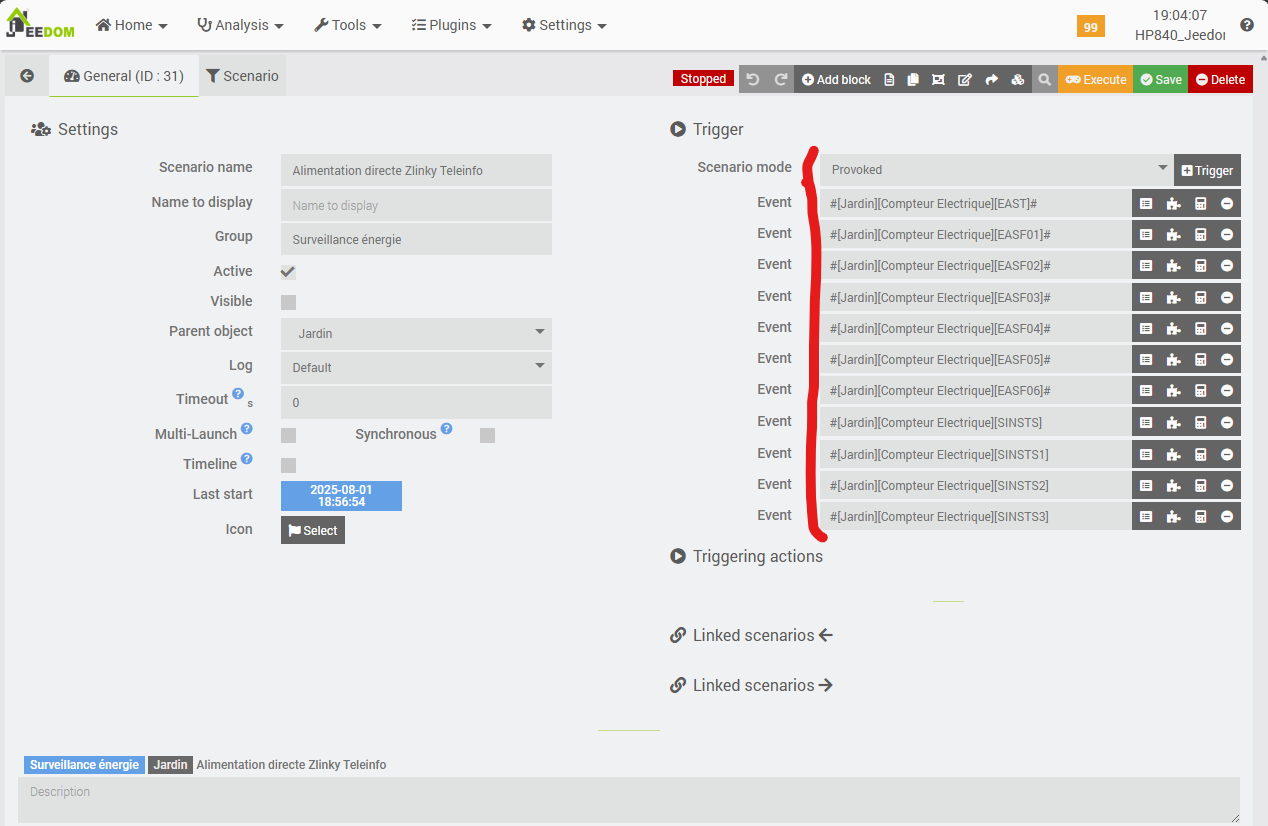
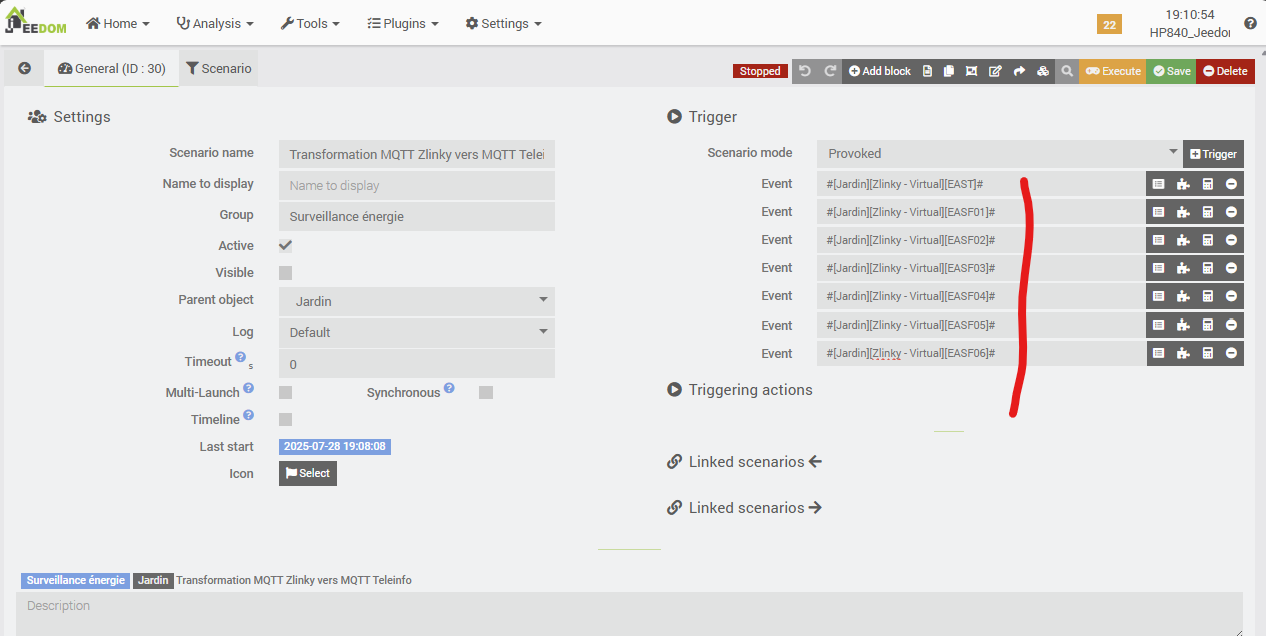
The scenario is of the “triggered” type (or, Provoked), meaning that it will be executed each time one of the values behind one of the commands indicated in the triggers changes. It’s very simple: in the “General” tab of the new scenario, we set all the commands that monitor consumption indexes (EAST* and EAST) as triggers, as well as those relating to instantaneous power delivered (SINST*).
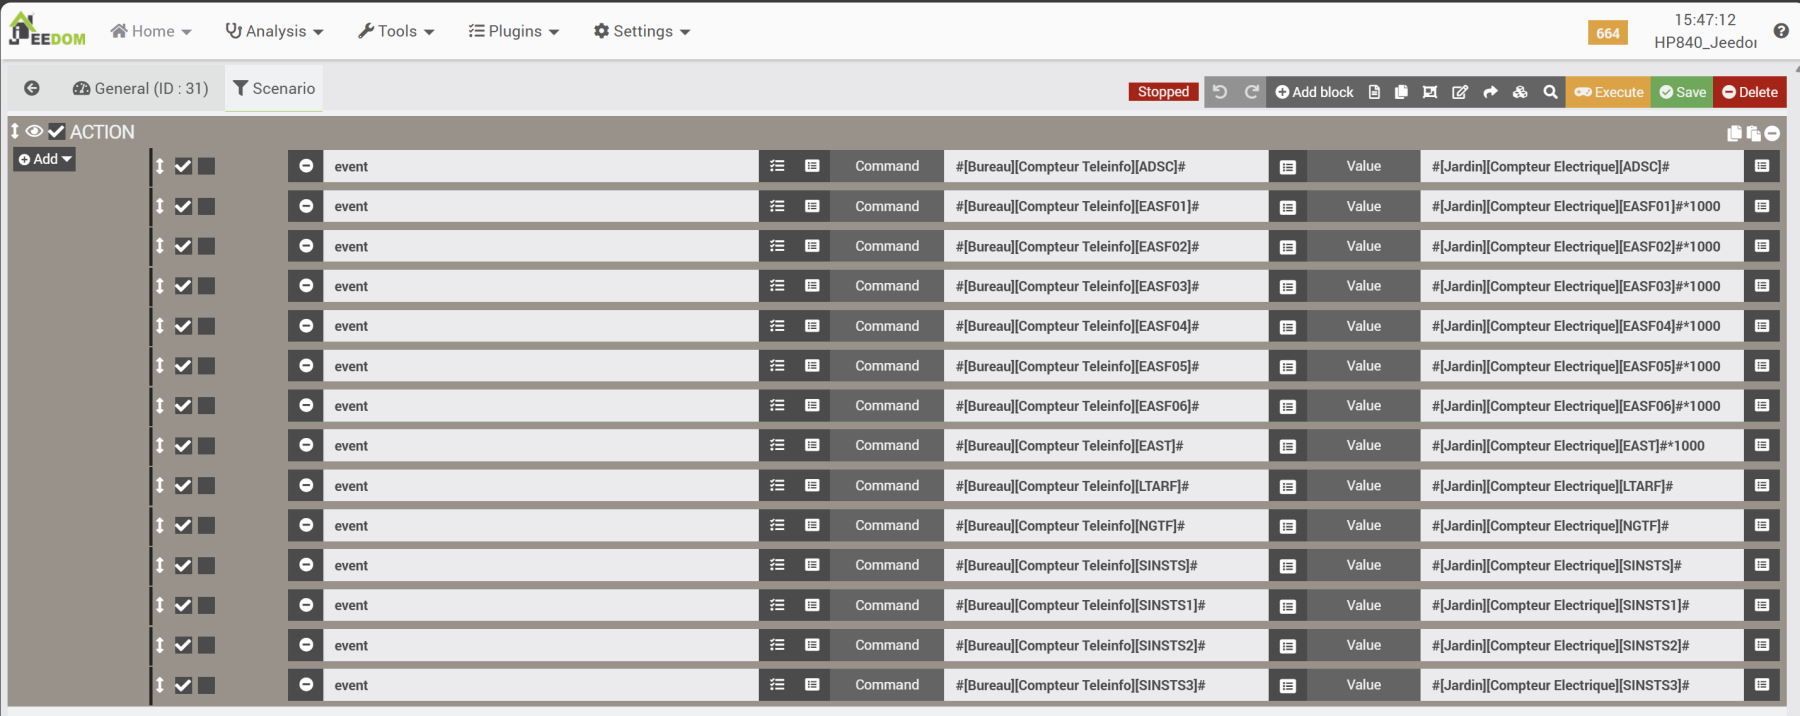
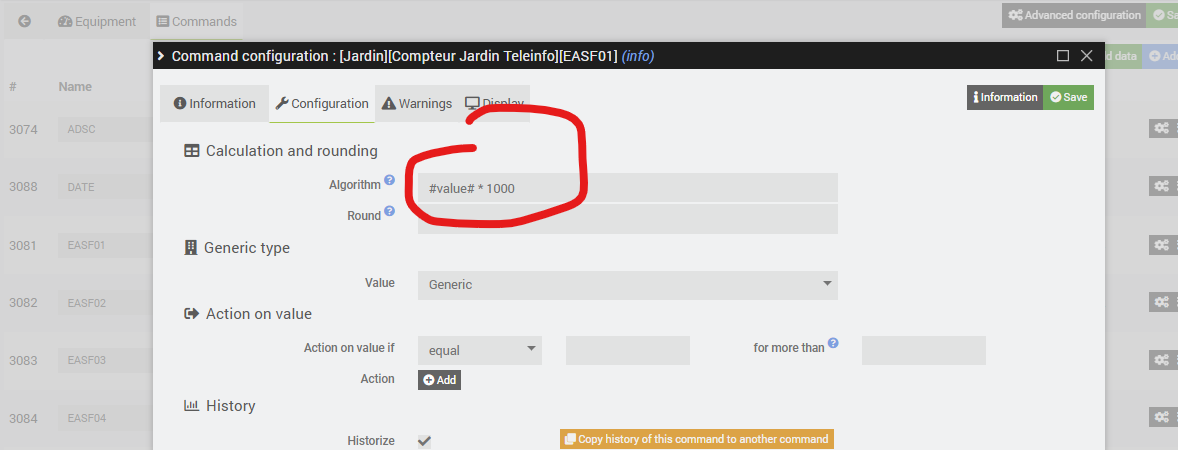
Finally, in the Scenario tab, we assign the values of the equivalent commands from the “Electric Meter” equipment to each of the new commands from the “Teleinfo Meter” equipment. A small detail: we convert the data from the EAST and EASF indexes from kWh to Wh. To do this, we simply multiply them by 1000.
Don’t forget to check that you have ticked the “active” box in the General tab, then save. From now on, each time the Zlinky value increases, it will first impact the “Electricity Meter” equipment in the Z2M plugin, then our scenario will update the data for the “Teleinfo Meter” equipment, which will log it and produce statistics used on its dashboard.
You can check the activity of the scenario by first checking its logs.
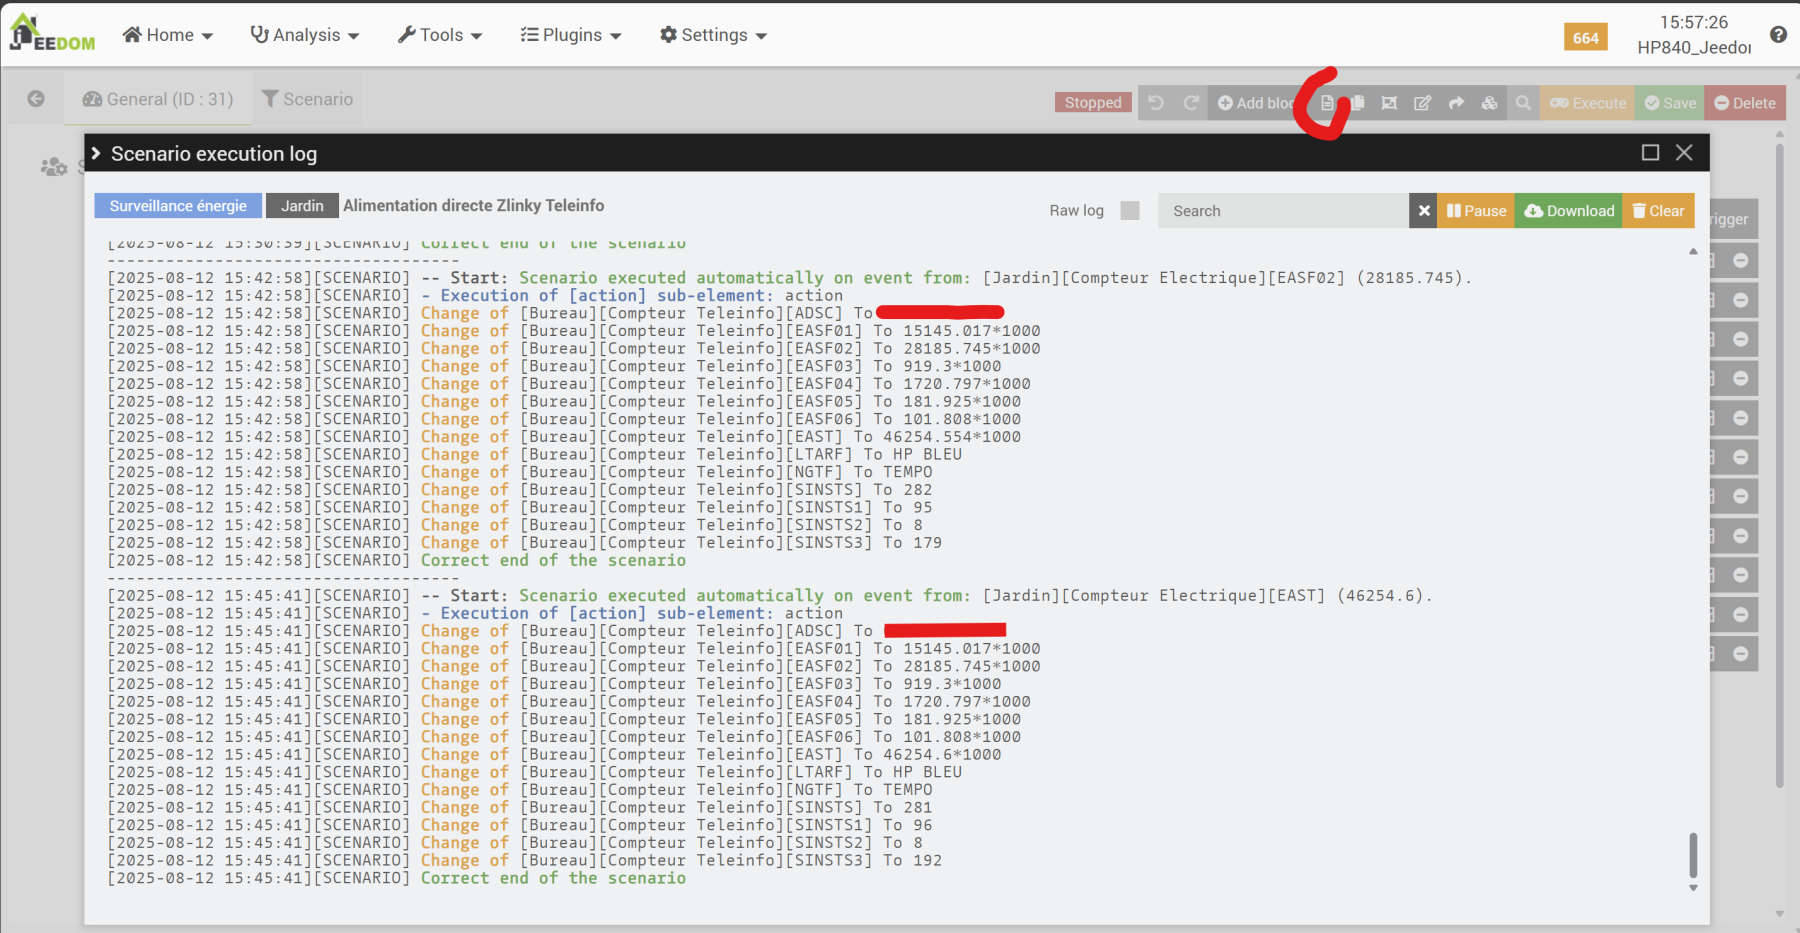
Then, we can check the values associated with the commands for the “Teleinfo meter” equipment, which should normally be the same (give or take the time between my screenshots).
We can see that the data is identical, except for EASF02, which has increased slightly between the two screenshots. That’s perfect.
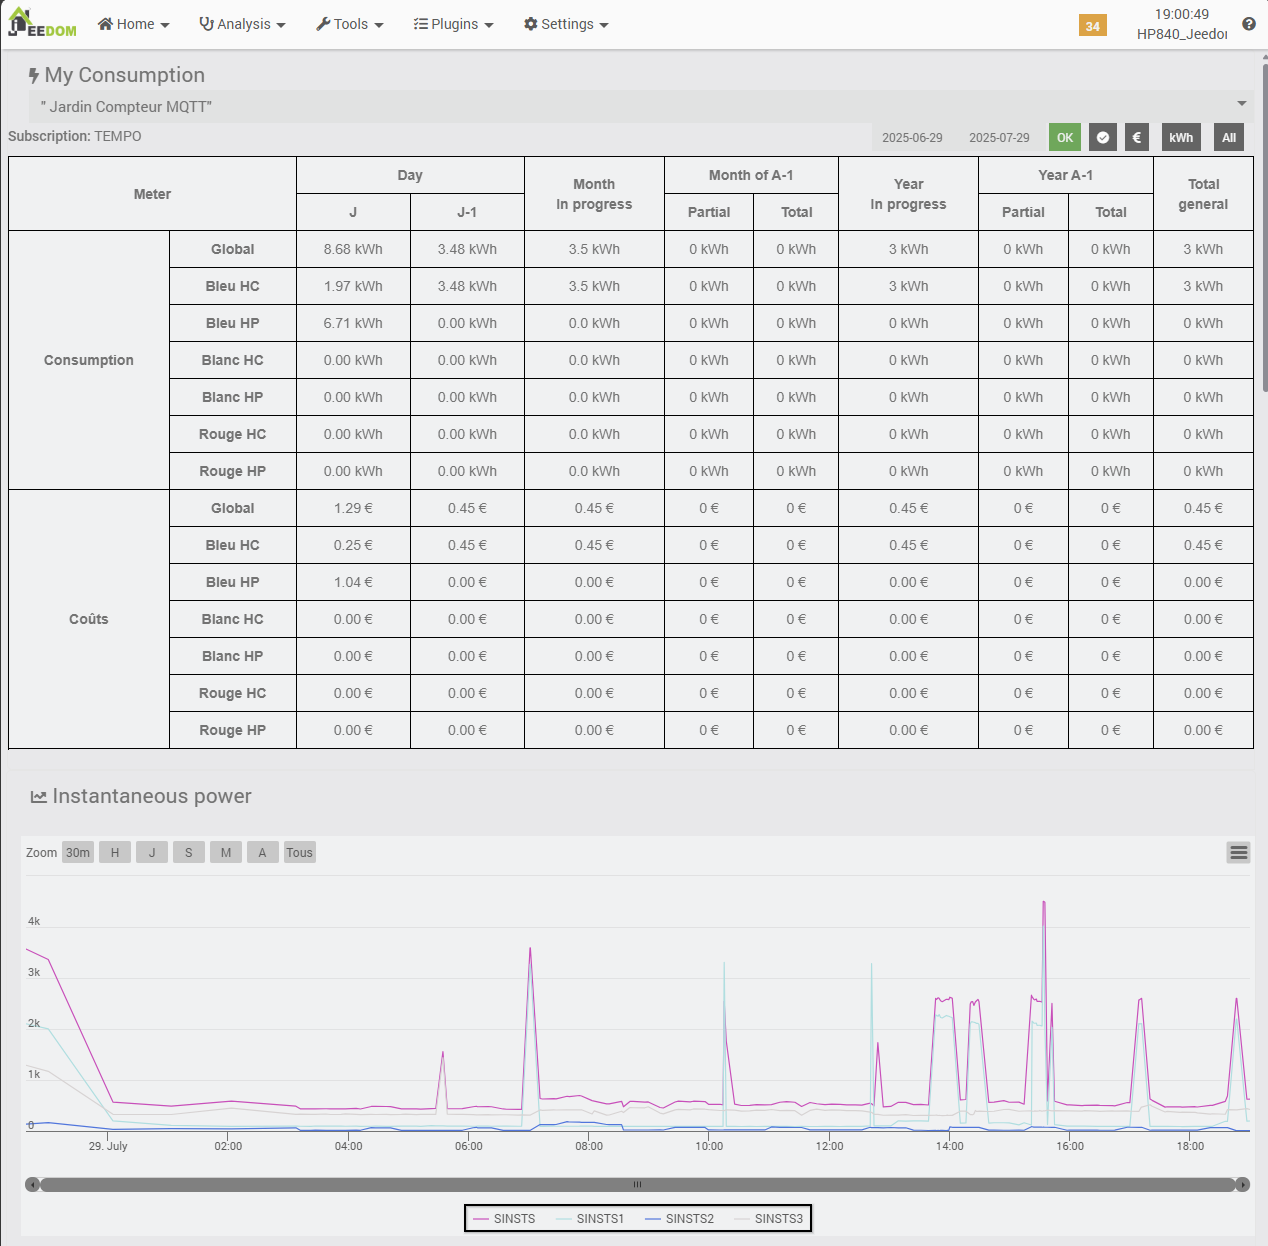
7e. Teleinfo plugin’s Dashboard
I waited a few days after setting up the data feed scenario to present the Teleinfo plugin dashboard with the initial statistics. We can already compare consumption and costs over several days, which allows us to identify the main areas of consumption (depending on which devices are turned on or off) and any imbalances between phases, which can be problematic.
To access the dashboard, you must have enabled it in the plugin configuration. Then, simply go to the Home / Teleinfo menu.
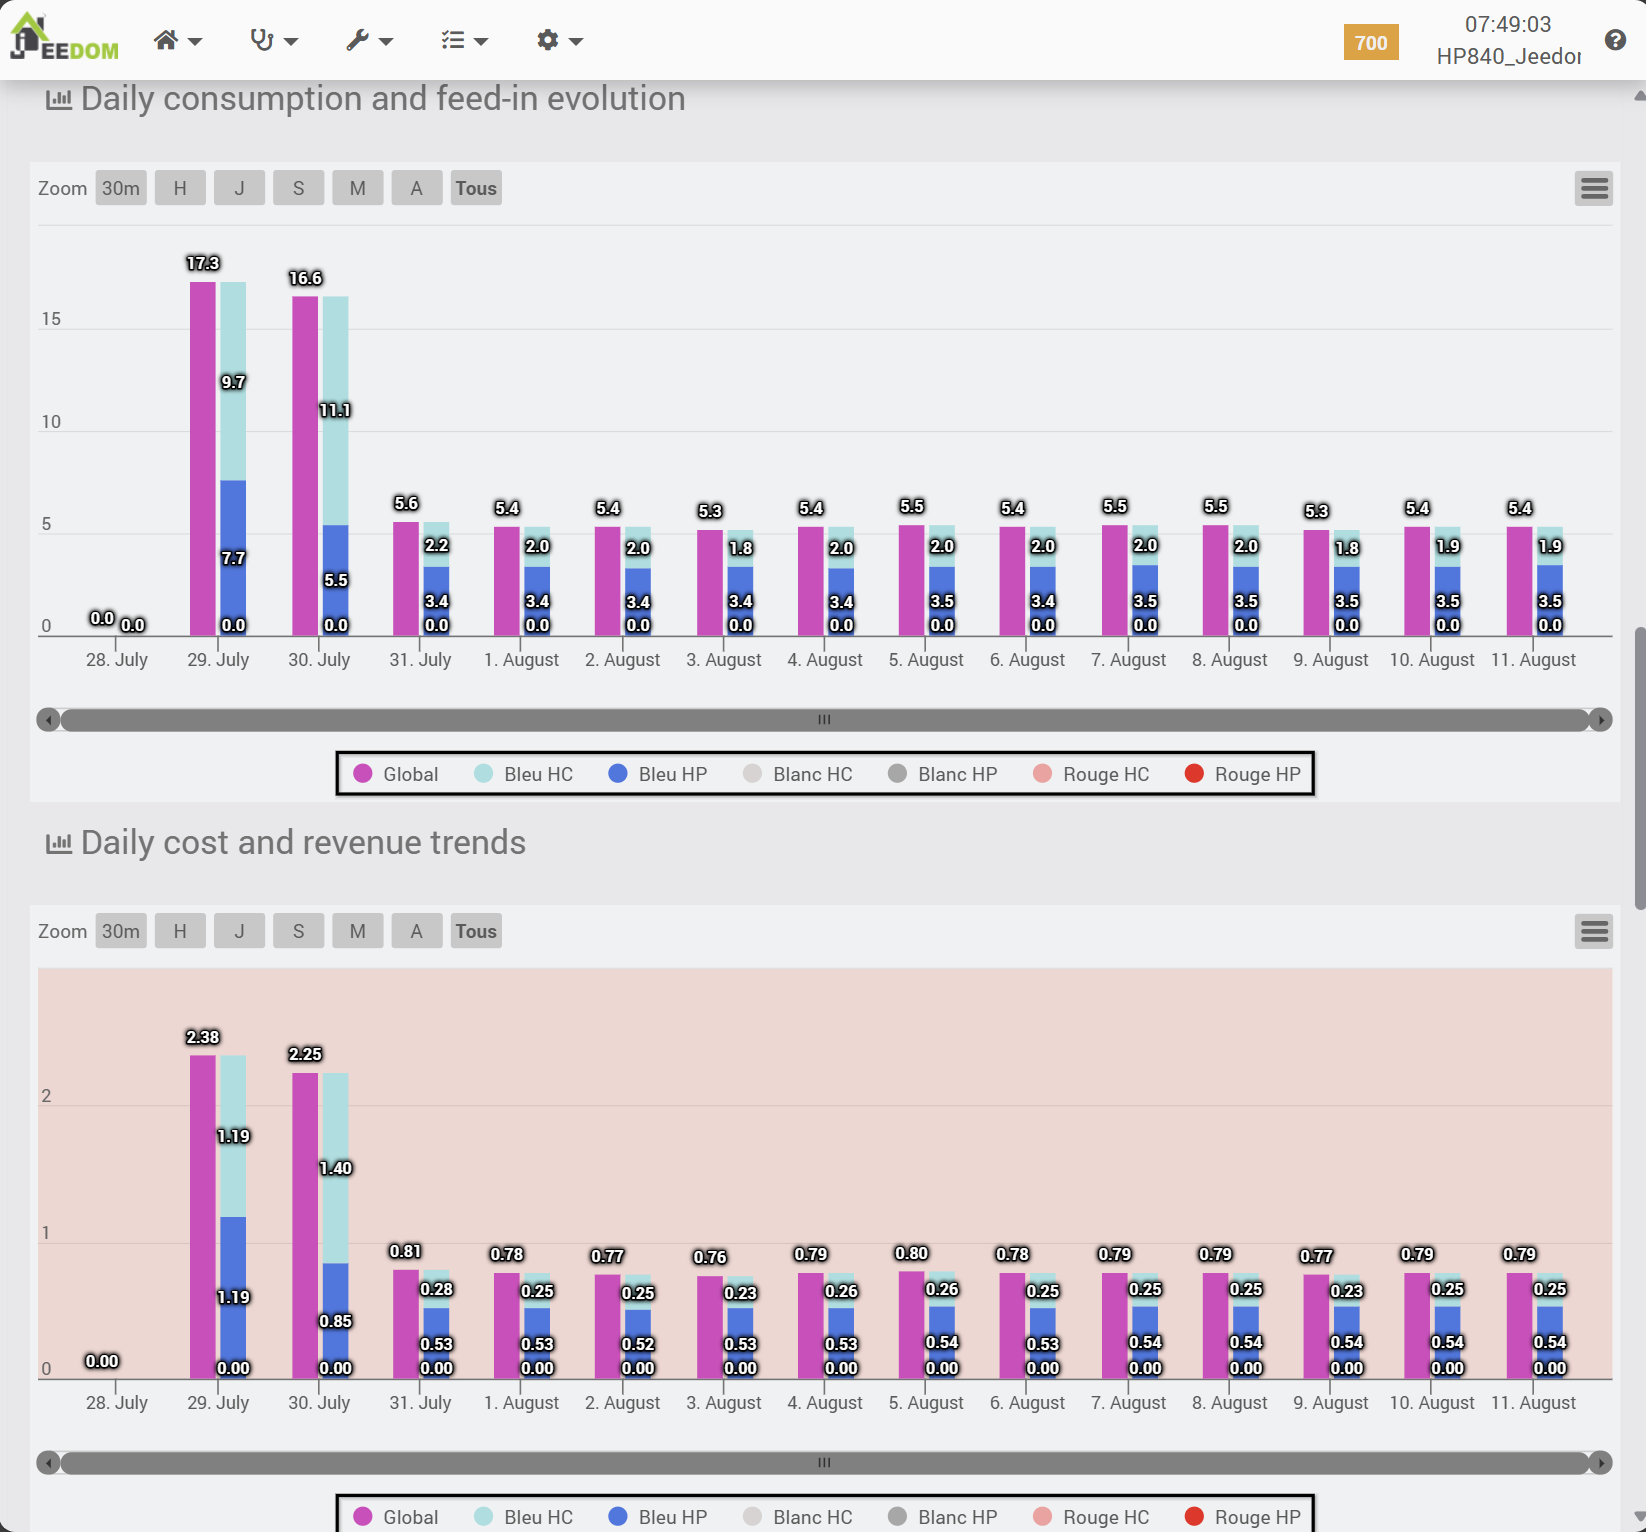
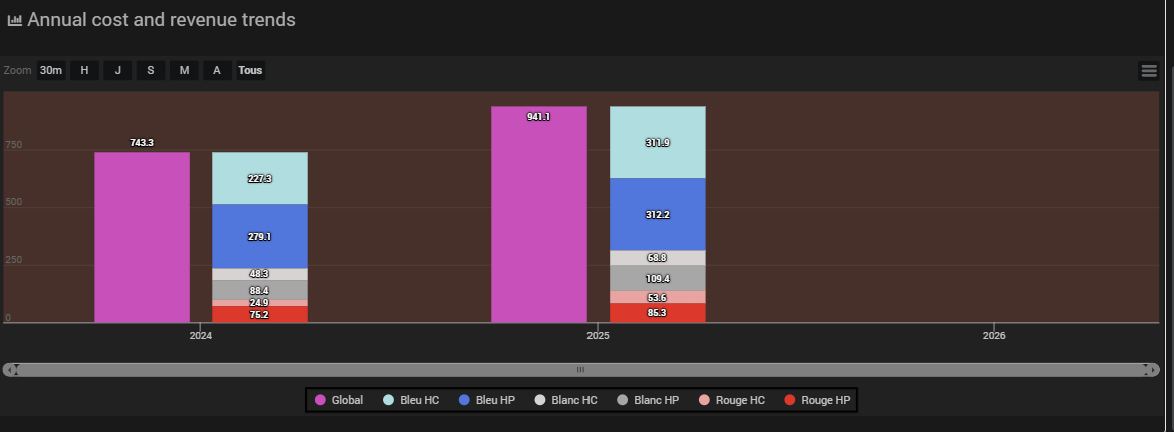
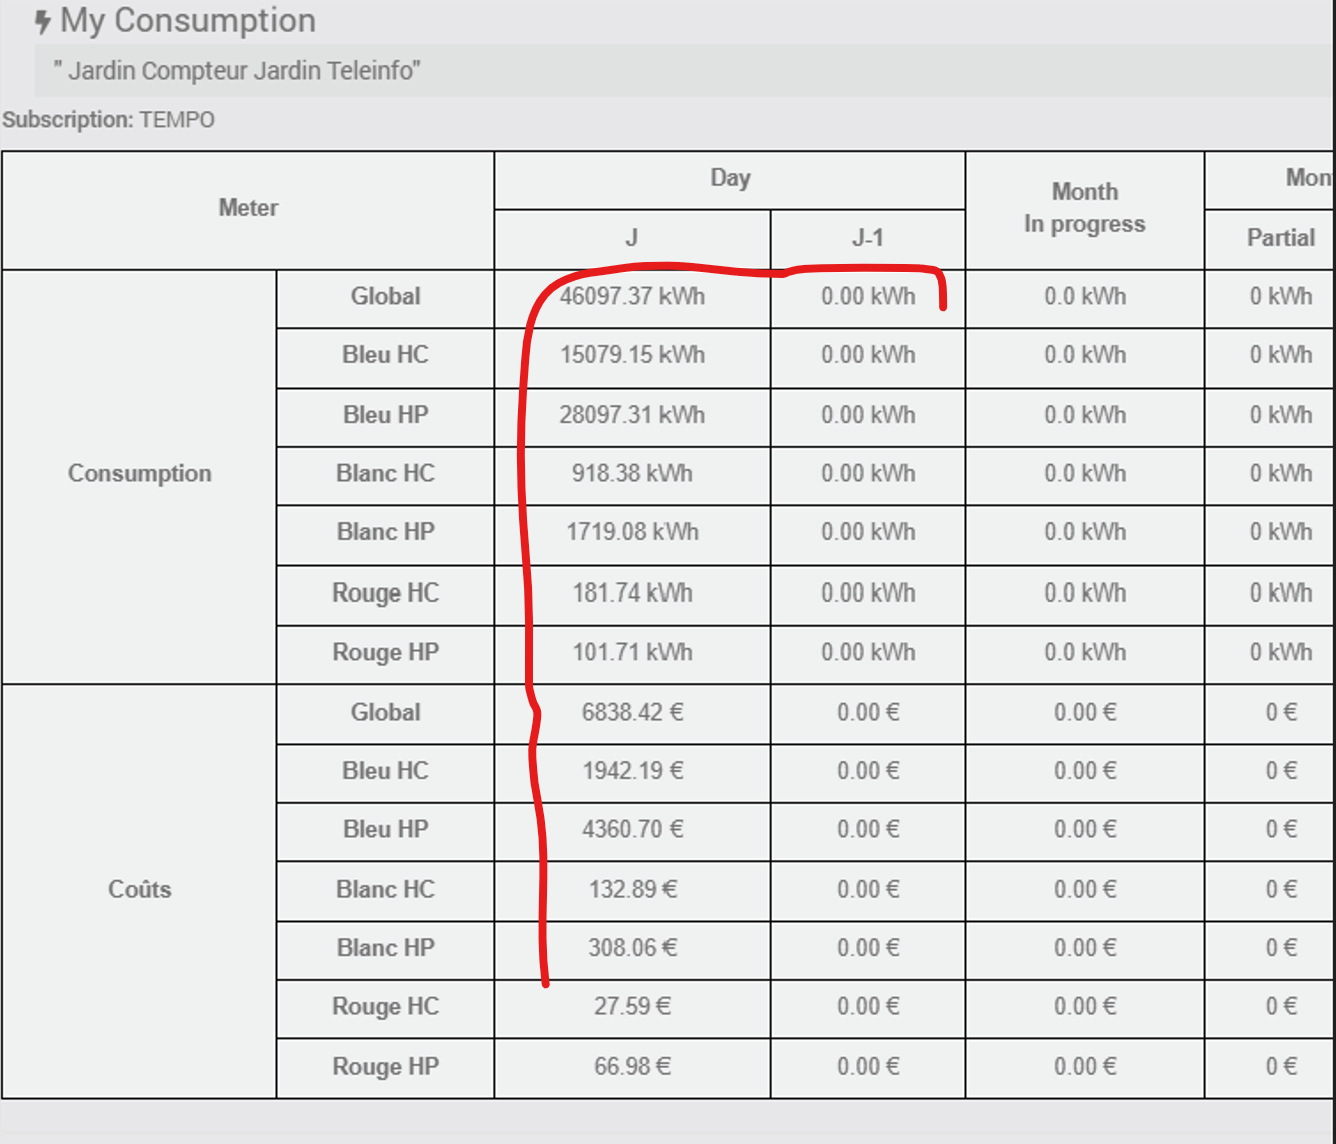
The first figure is a table showing consumption details for D, D-1, the current month to date, month -1, the current year to date, and year -1, all by tariff period, using the names of the tariff periods that we have configured in the equipment.
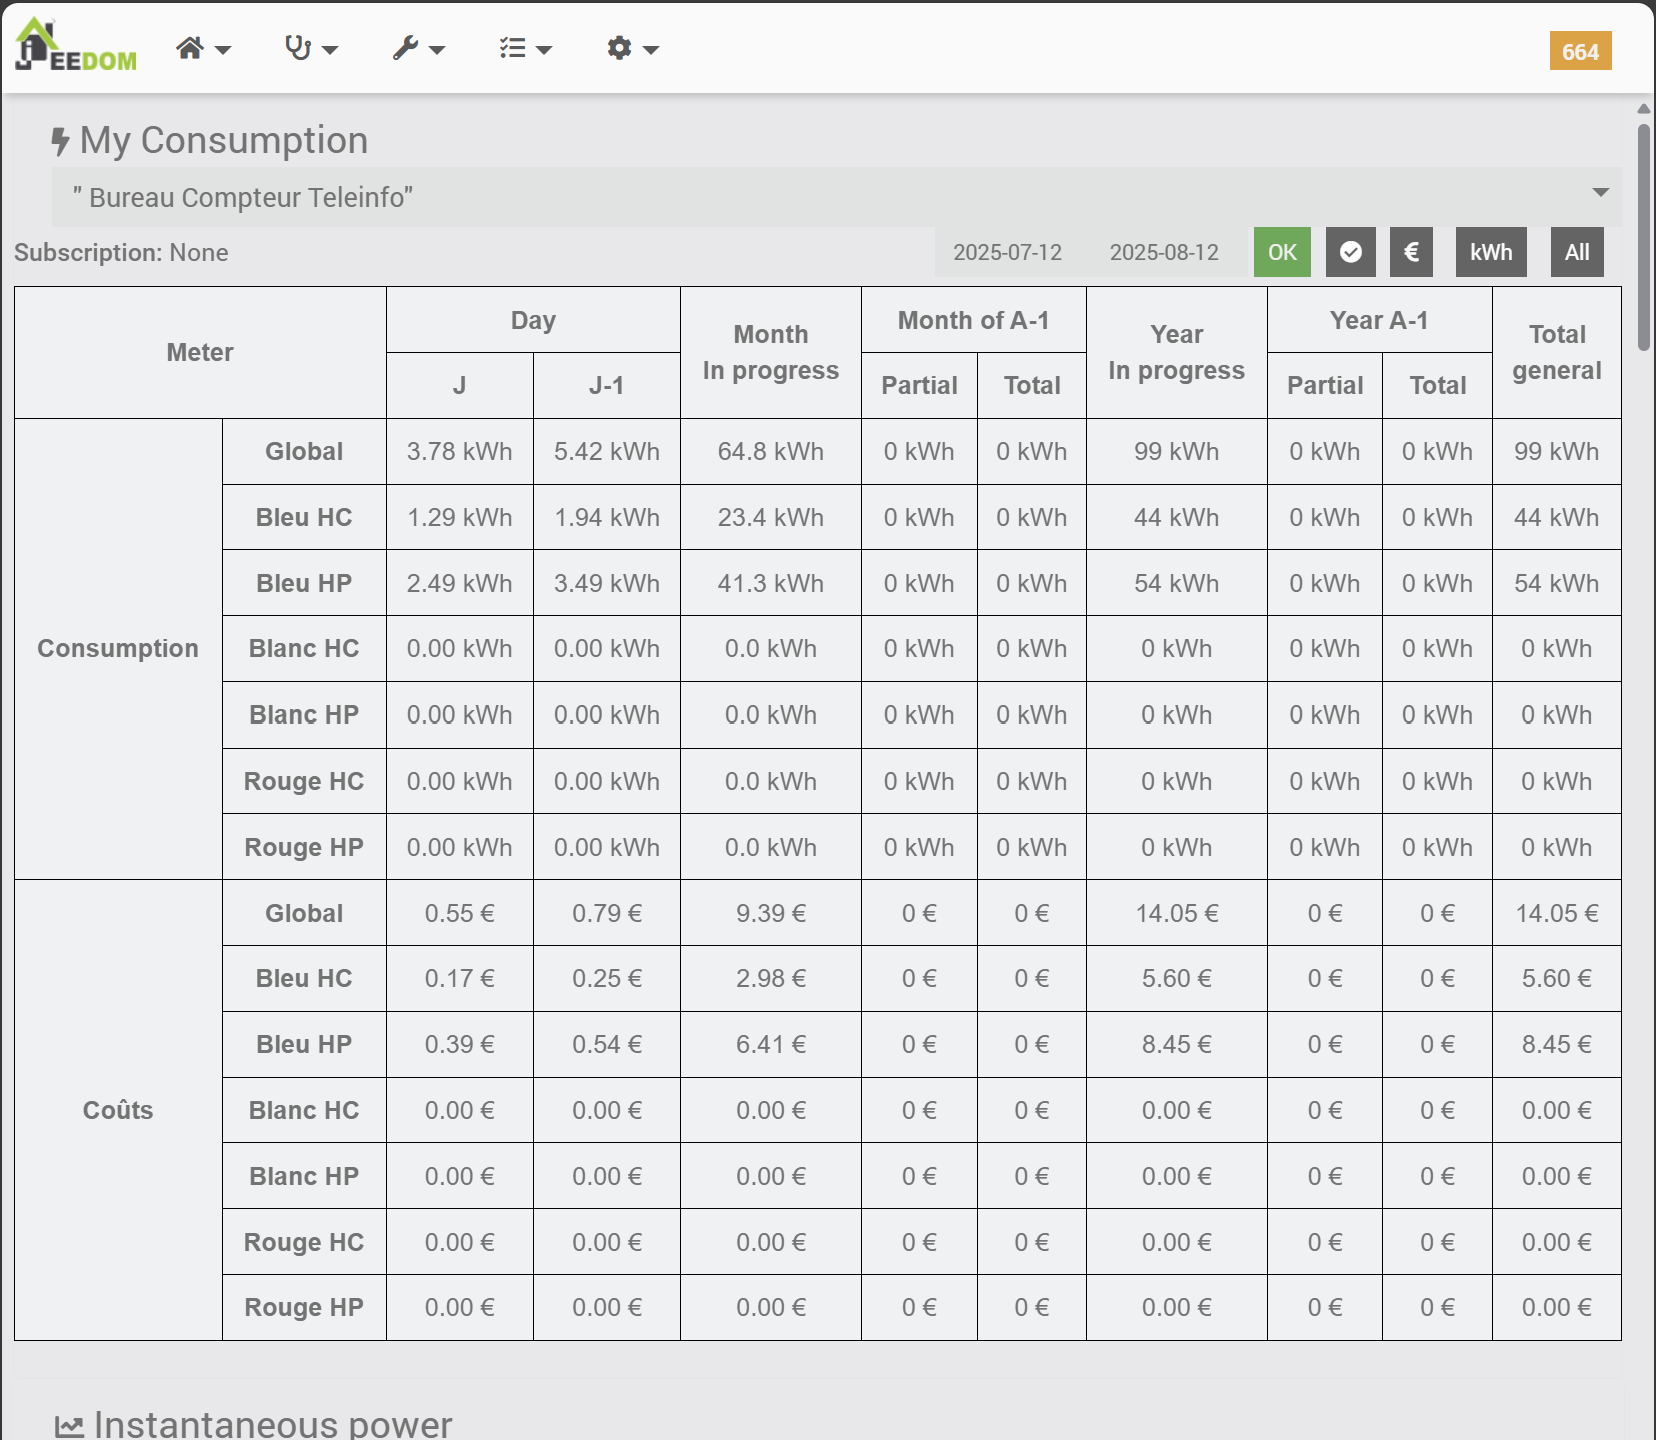
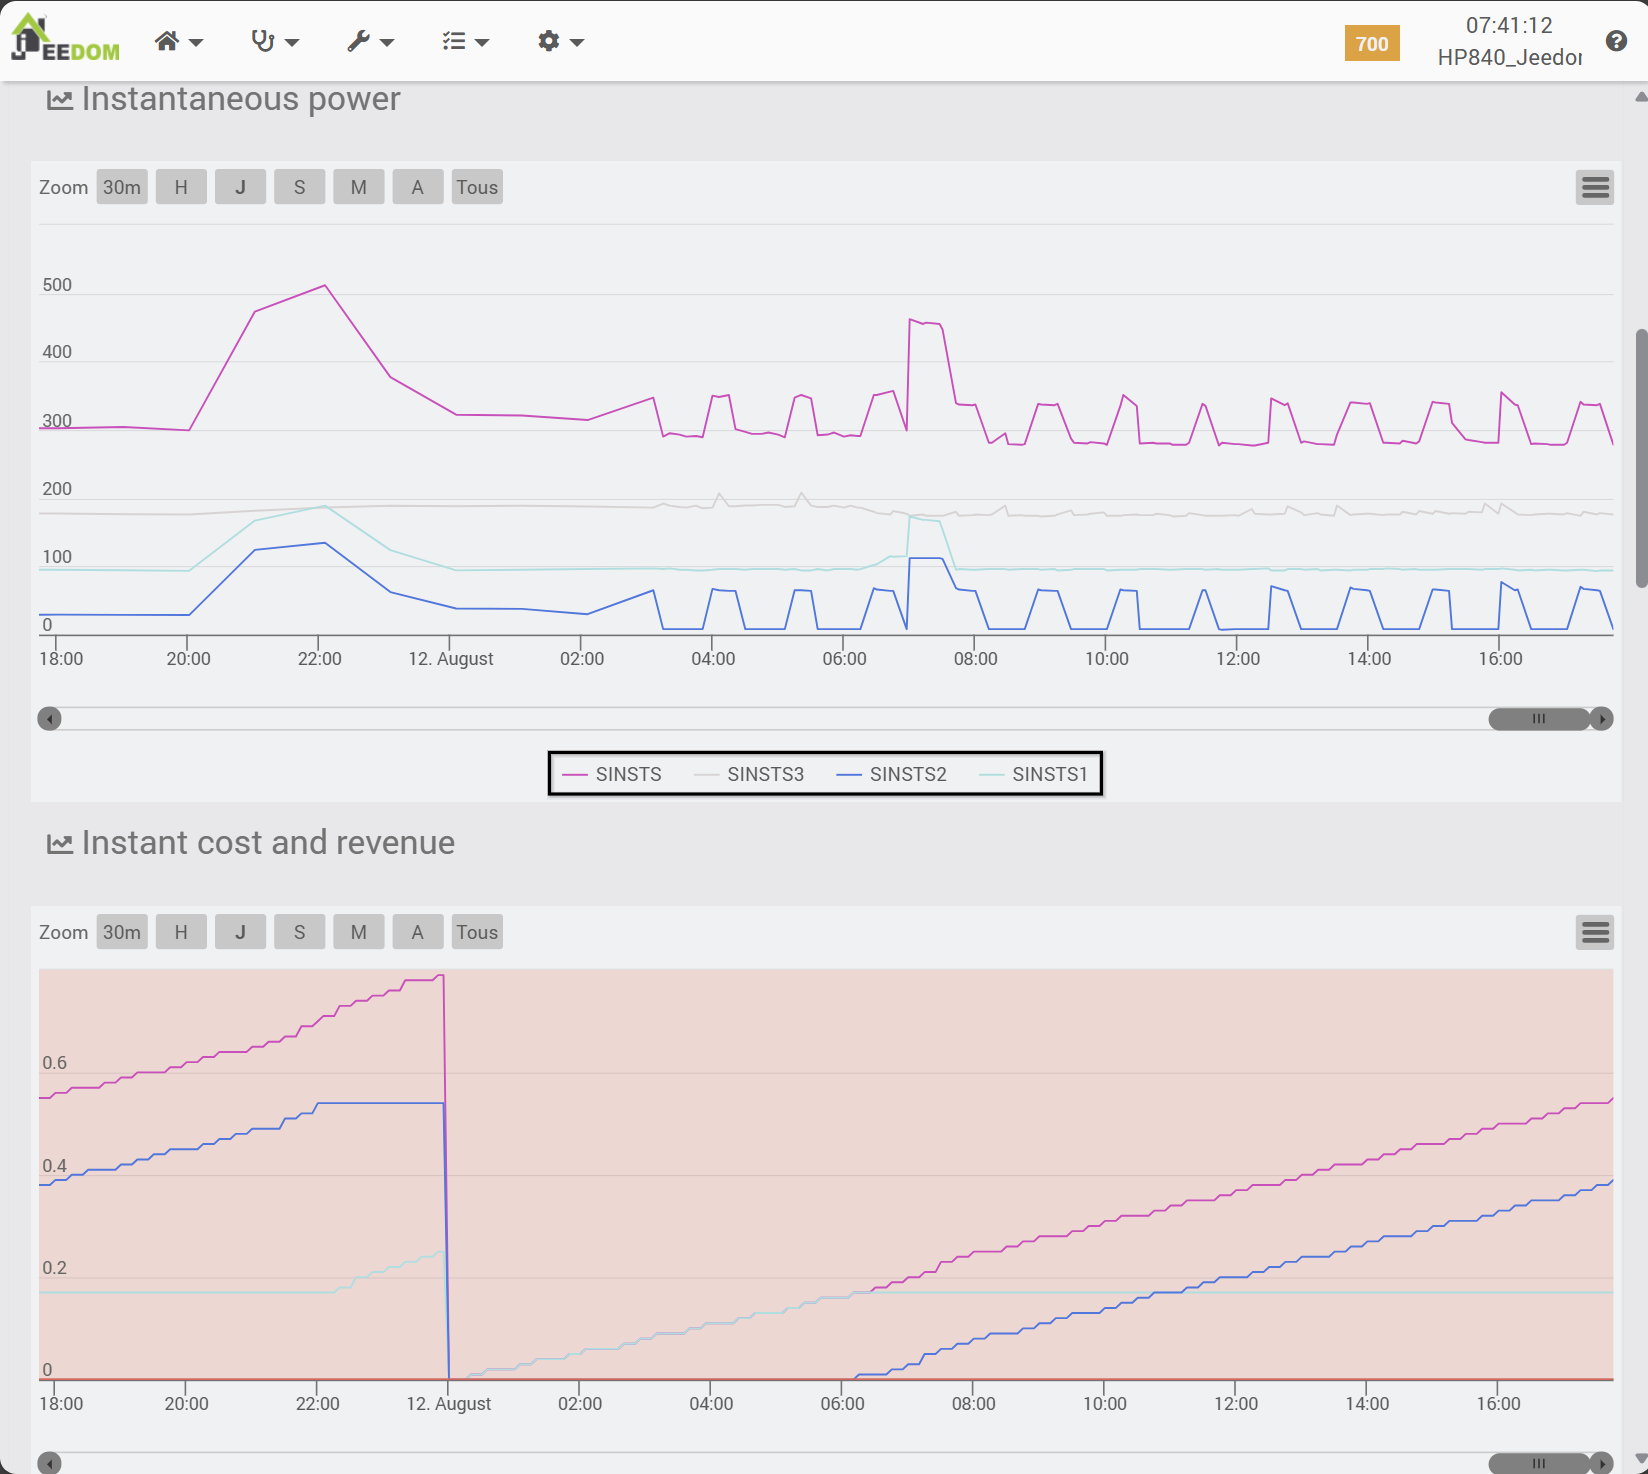
Next, we see the history of the power delivered (in Volt-Amperes), by phase. Here, for example, we can see that over the last 24 hours (with virtually no activity in the house), phase 3 of the installation is generally 2 to 3 times more loaded than the others. This is not a serious issue at this stage because the currents delivered remain low and no large equipment is consuming power, but it will need to be monitored.
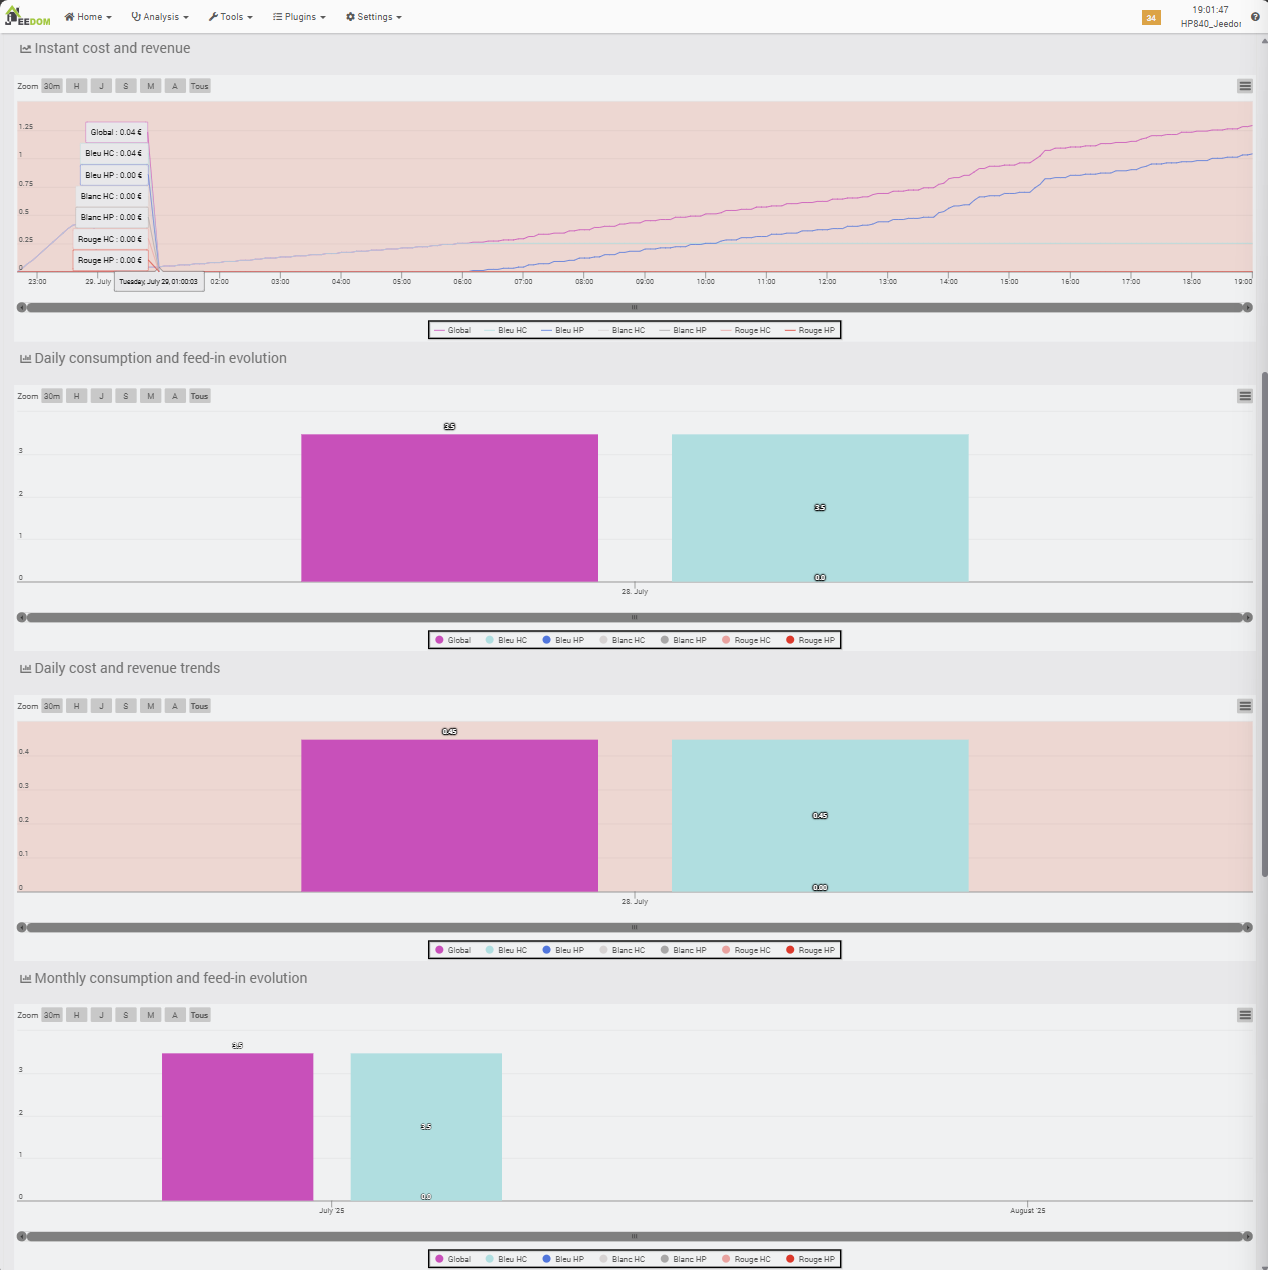
The second graph reveals an interesting concept that we have not exploited: the plugin is also capable of integrating electricity production, in the case of a personal installation connected to the domestic grid via the electricity supplier (resale of electricity produced). This is not the case here, as there is no such installation, so there is no concept of electricity produced in the statistics.
We can then compare daily consumption, then the associated costs, and track their evolution over time, always based on the tariff period. Here too, if we were electricity producers, the corresponding information would appear.
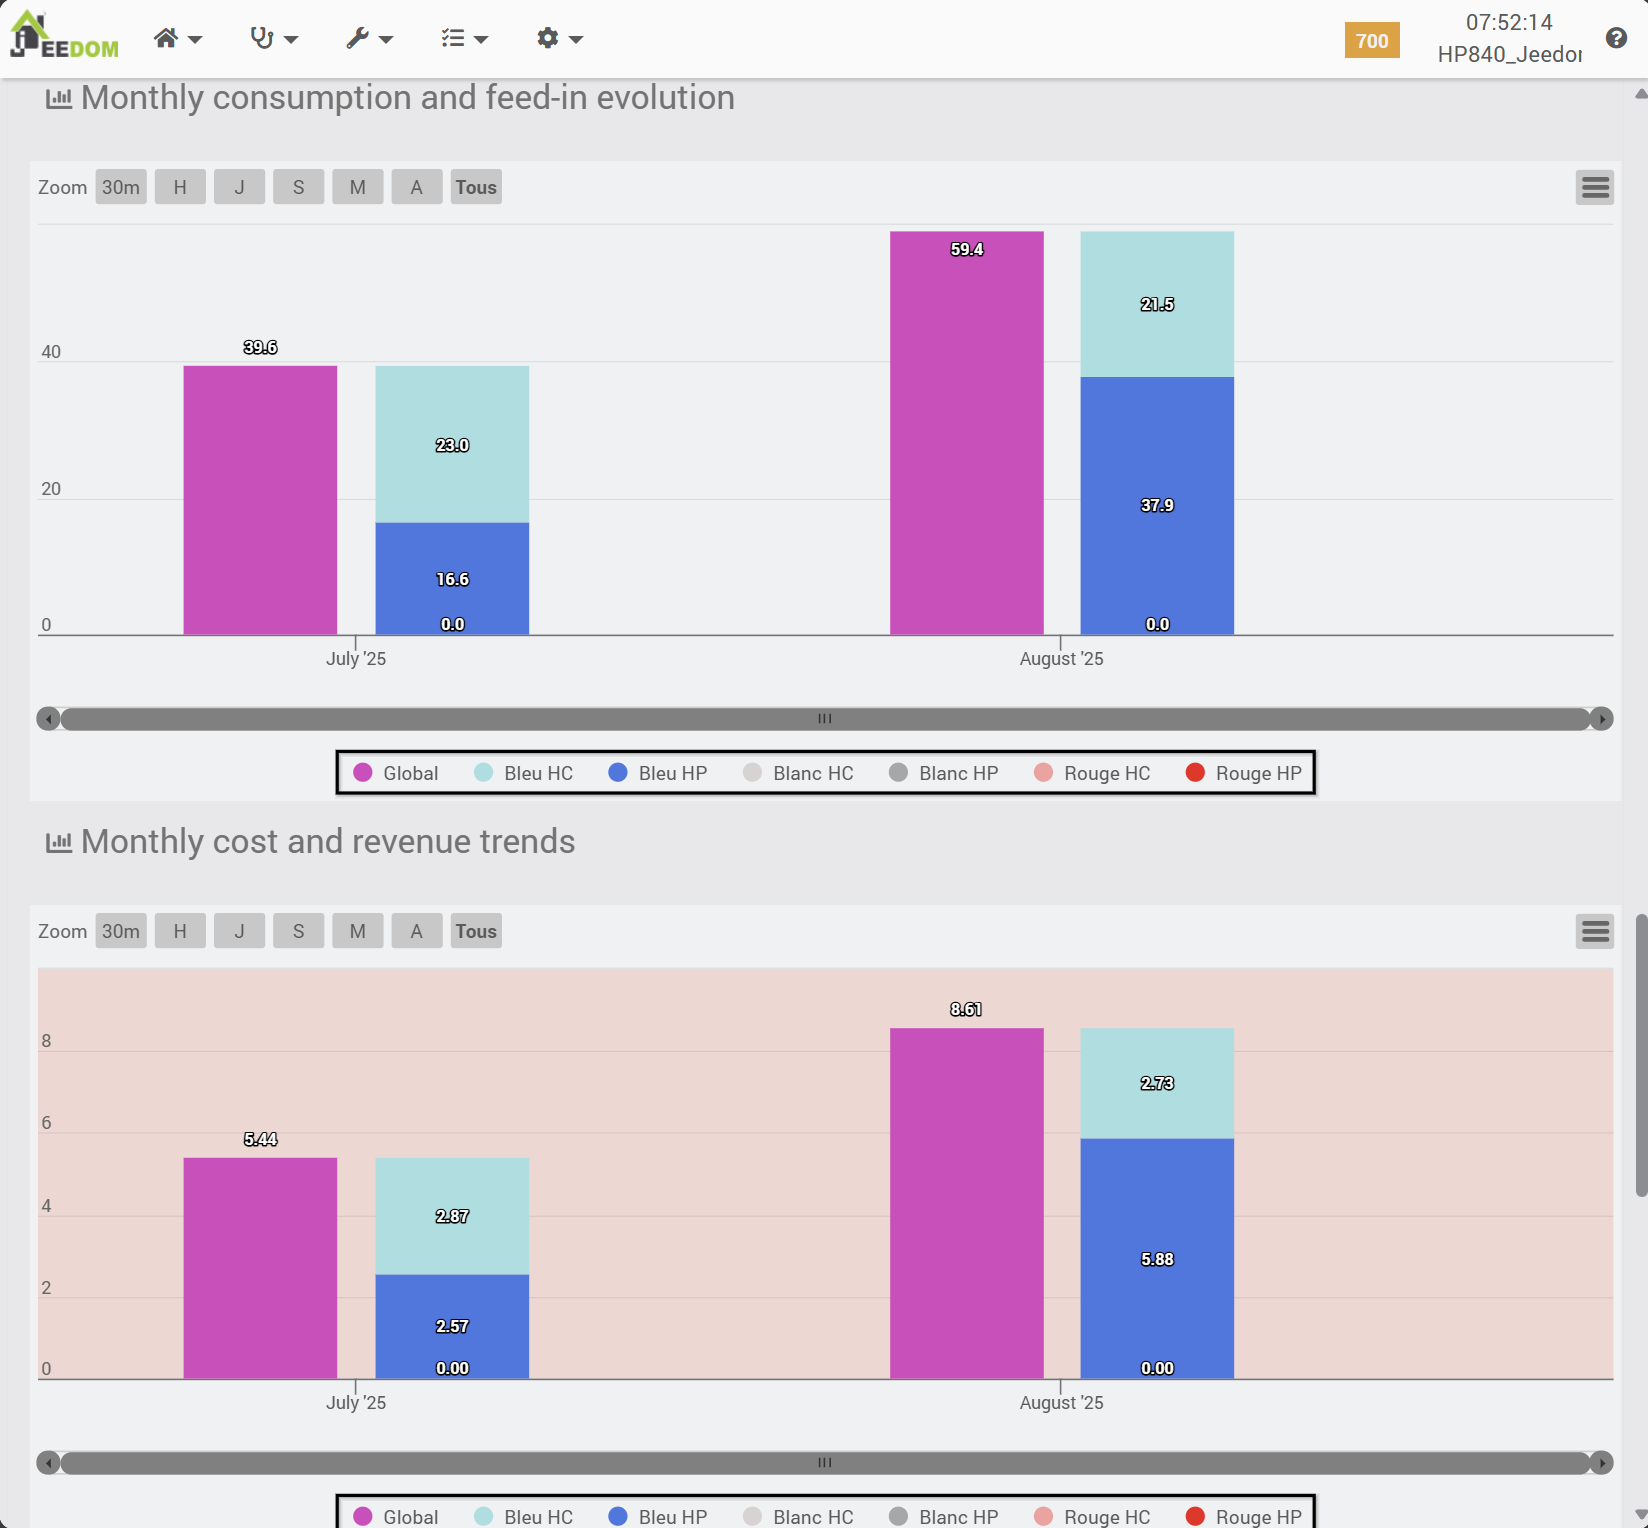
The same thing on a monthly basis.
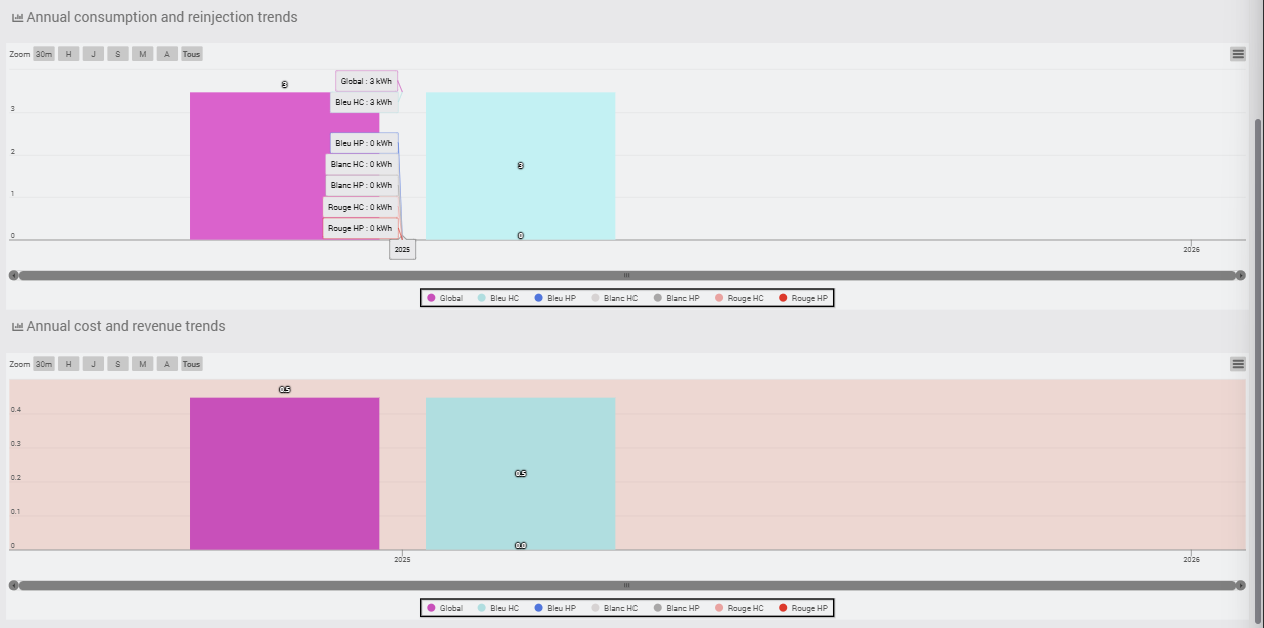
AND finally, the same view but annually.
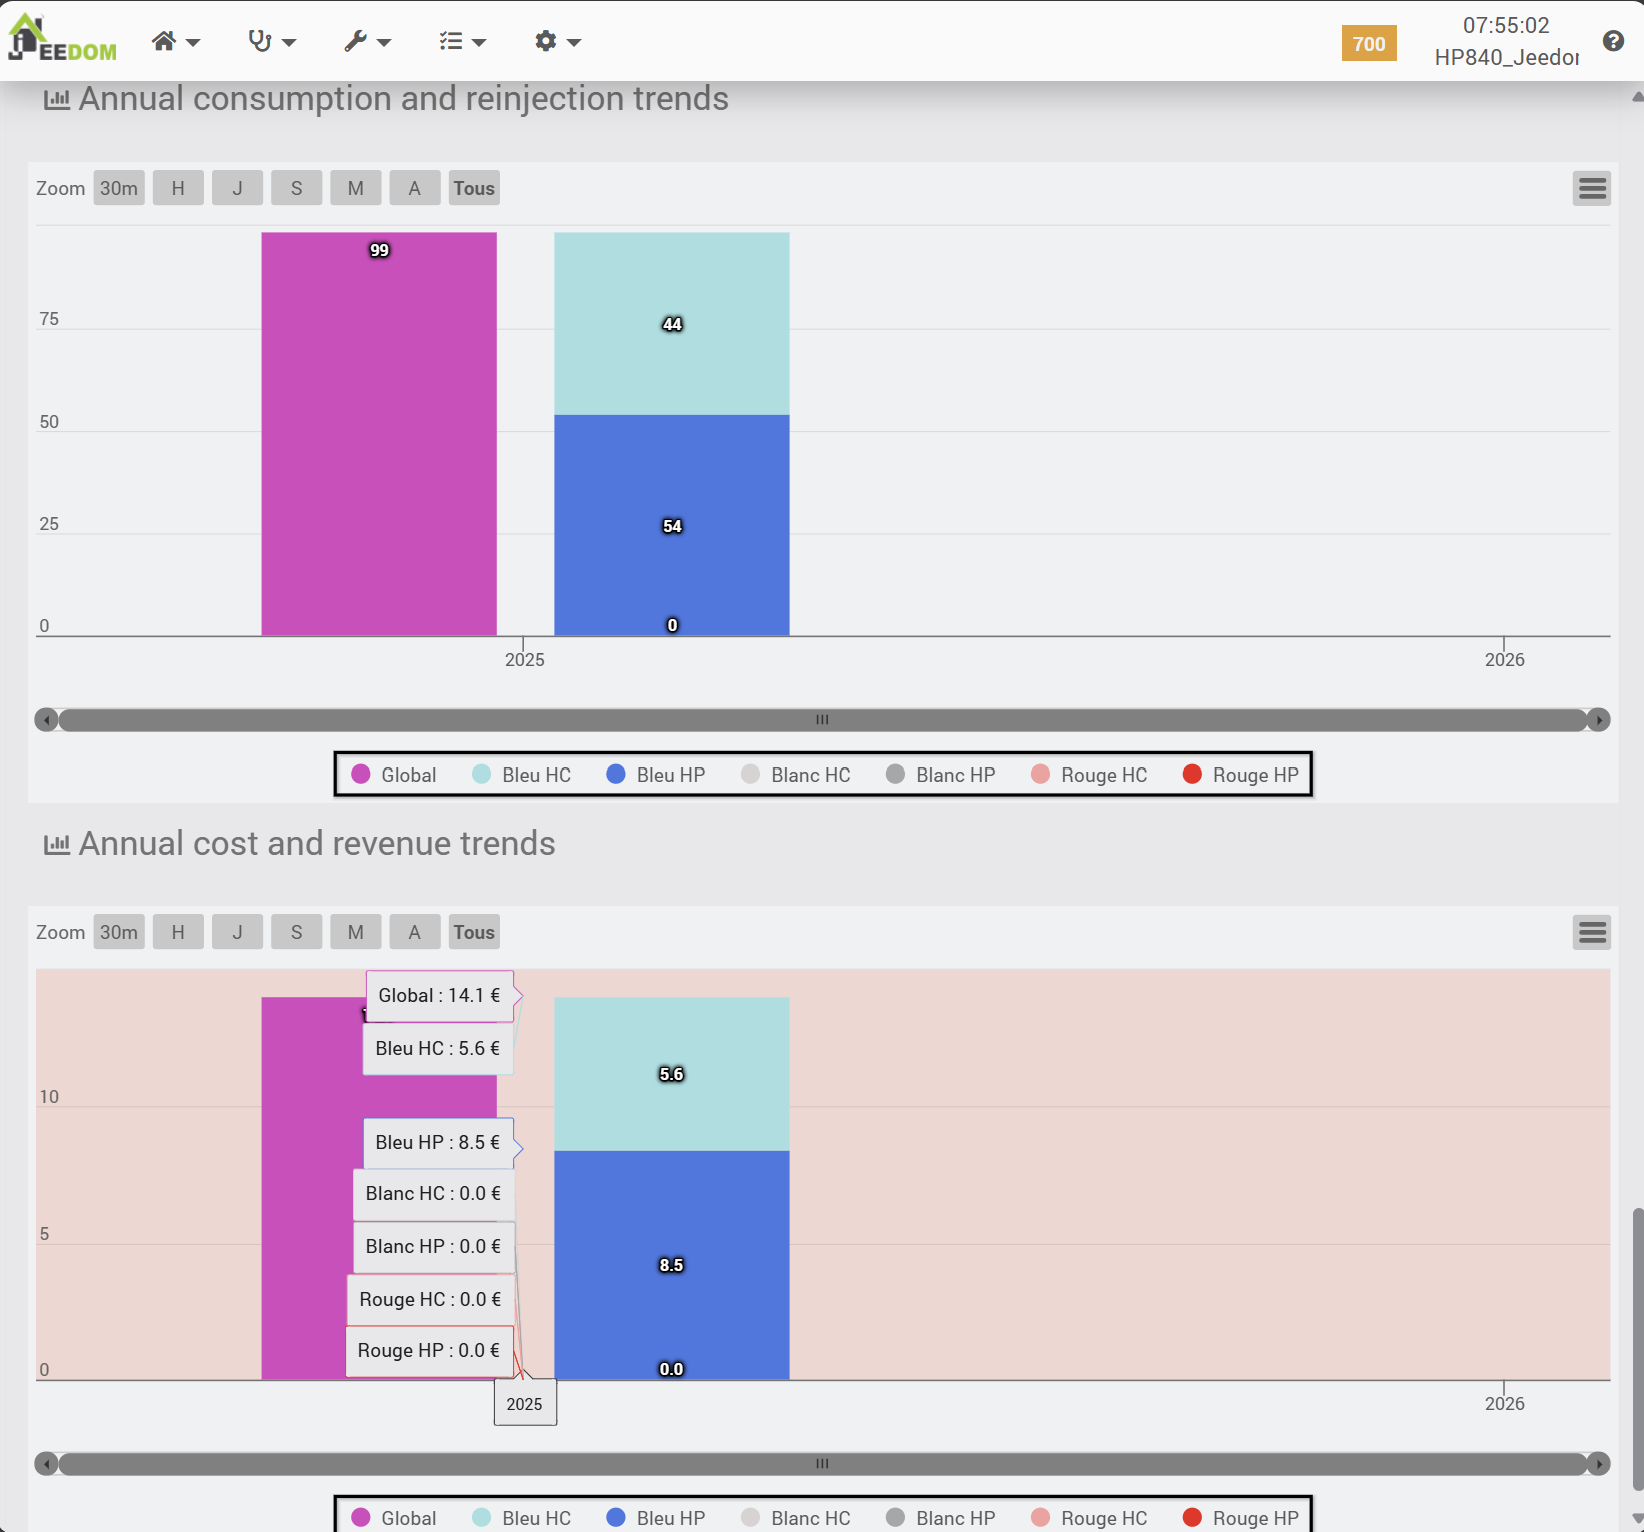
Ultimately, this allows for genuine comparative monitoring over time. For example, here is a view of the same plugin in my apartment (installed in May 2024):
8. Quality of the connection between the Lixee and the controller
8a. Tracking indicator
There is a link quality indicator with Zigbee, called LQI, which stands for Link Quality Indicator.
Between two nodes in the Zigbee network, the LQI value will reflect the quality of the radio link. The LQI does not measure the raw signal strength (that is the role of the RSSI, or Received Signal Strength Indicator), but rather the reliability of the communication—that is, the proportion of bits received without error. Thus, a link may have a correct RSSI but a low LQI if it experiences a lot of interference.
Note that different chipsets may estimate LQI differently, depending on their internal calculation algorithms, but theoretically the formulas should remain similar.
The LQI value range is between 0 and 255:
- 200 to 255: excellent and stable connection,
- 150 to 199: good quality, to be monitored,
- 100 to 149: average quality, communication possible but intermittent,
- 0 to 99: poor quality, often causing packet loss or disconnections; move the device closer or add a Zigbee router to improve the mesh network.
8b. Monitoring
In the previously configured widget, we took care to display the LQI (what a coincidence!), as it is reported by the Zigbee2MQTT “electricity meter” device.
Above all, we have also taken care to record its values over time so that the progress of the LQI can be verified.
8c. Analysis
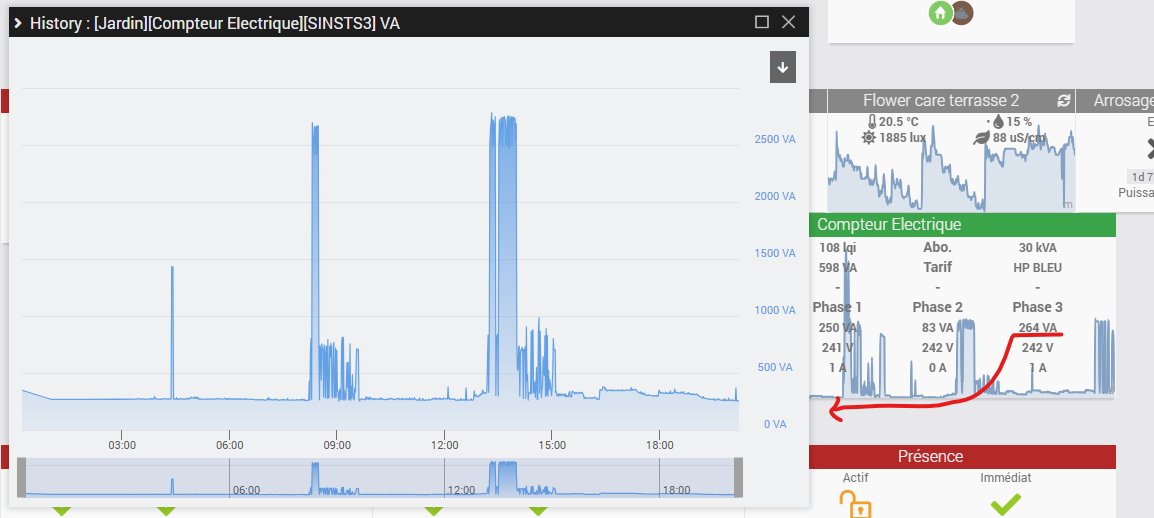
Let’s take a look at the complete history via the “Analysis > History” menu. Since it took me a few months to publish this article, the advantage is that I now have quite a bit of perspective on the evolution of the LQI 🙂
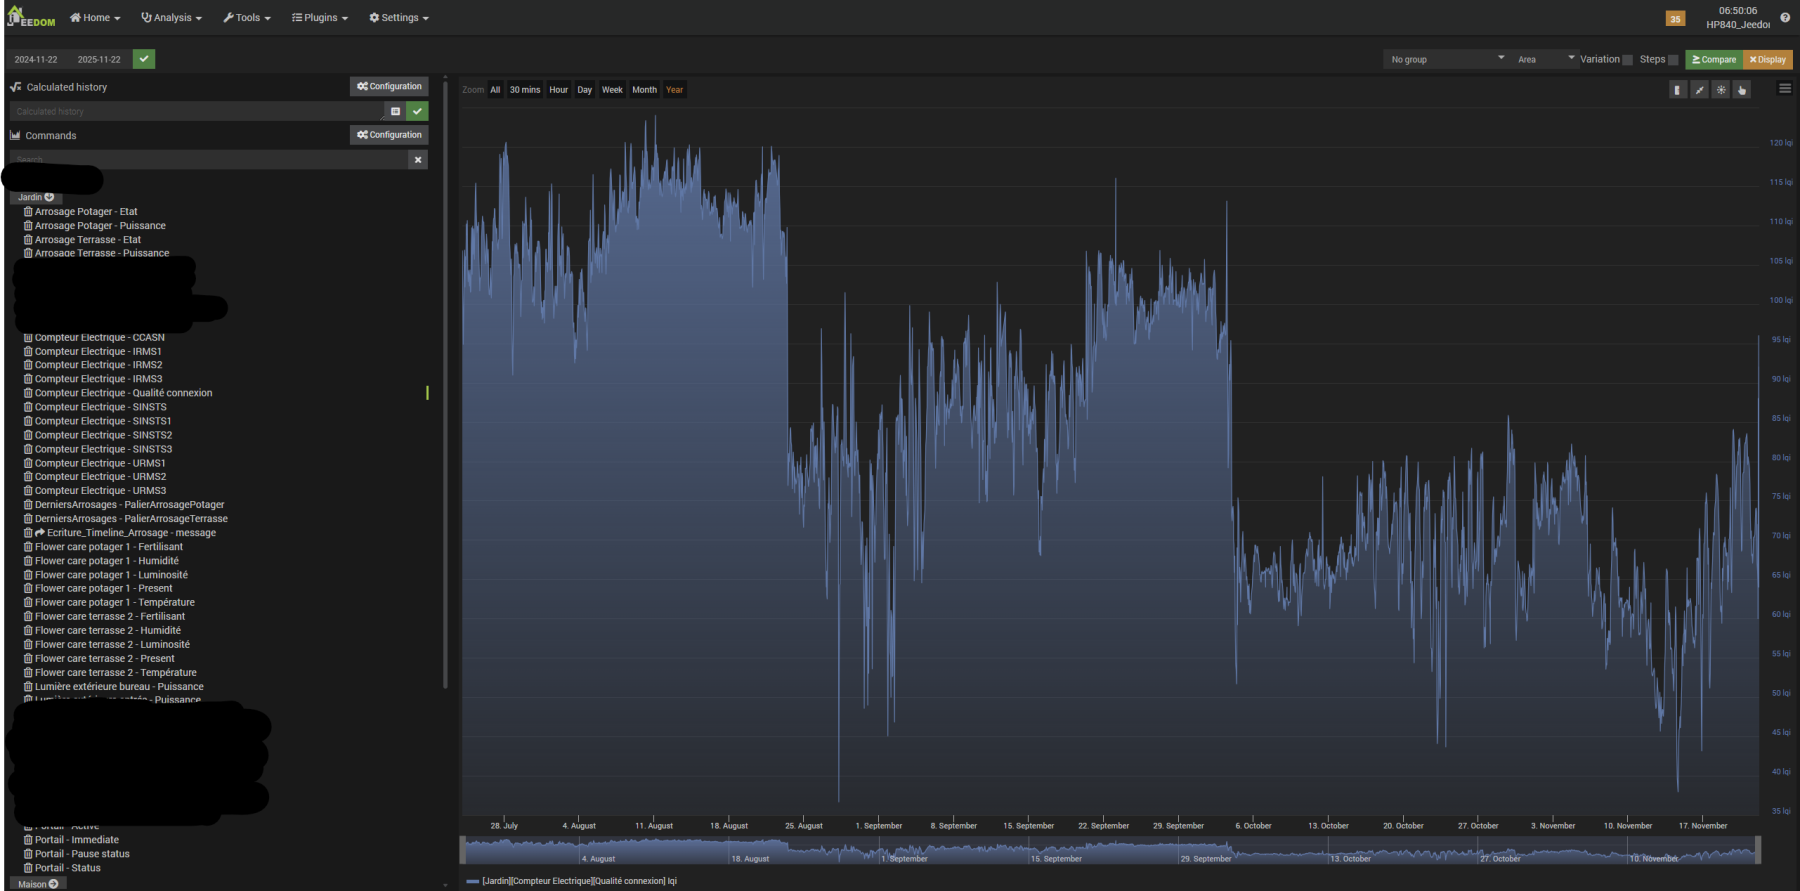
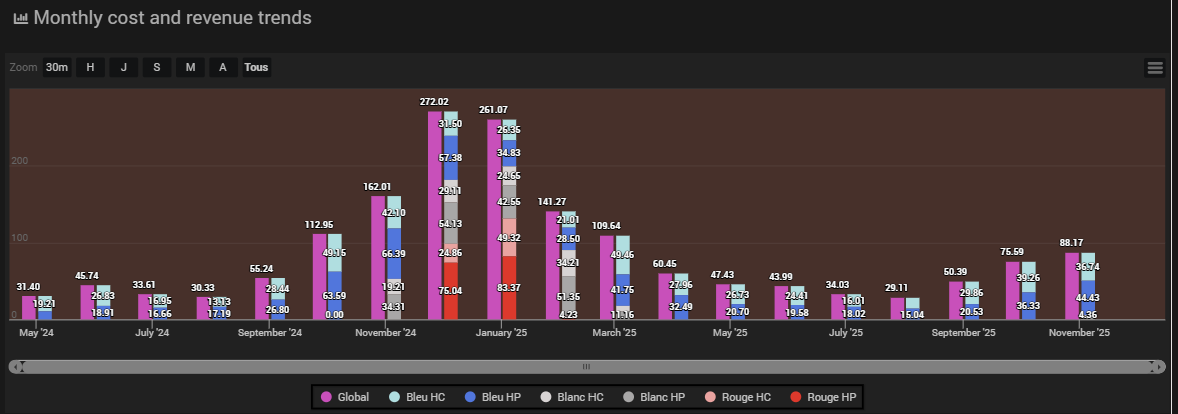
As we can see, from its installation until August 23, the LQI averaged 110, which is average but acceptable.
On August 23, it fell sharply to 80, then, until October 3, the signal fluctuated wildly but overall trended upward to return to 100 (it’s like analyzing a highly volatile stock/crypto market…).On August 23, it fell sharply to 80, then, until October 3, the signal fluctuated wildly but overall trended upward to return to 100 (it’s like analyzing a highly volatile stock/crypto market…).
On October 3, it then fell sharply to 60 or even 50 on November 3, and gradually rose again, fluctuating greatly, to around 80 today, November 22.
From a signal of acceptable quality, we now have a rather mediocre signal. Nevertheless, the values are being transmitted correctly, and the consumption indexes are being updated properly. However, transmission is not optimal, and it is likely that retransmissions will be necessary on the Zigbee network to achieve a viable result in the Teleinfo plugin. Thanks to the retransmission algorithms in the network protocols and higher OSI layers.
I should mention that, since everything is working well enough from Jeedom’s perspective for now, I haven’t tried to analyze this phenomenon in more detail. I did try rebooting the Zigbee controller, but it didn’t change anything. I also checked if the power_transmission setting we added in the configuration.yaml file was still present after a few plugin updates.
I suspect the issue is simply that the outdoor antenna connected to the SLZB-06M isn’t actually fixed to the wall, which means it can move around depending on the wind. The analysis—and hopefully the resolution—of this issue will either be part of an update to this article, or have its own dedicated section in a future post about Zigbee & Wi-Fi network arrangements.
There you go, the article is (almost!) finished. Thank you to the readers who have stuck with me this far <8)
9. Conclusion
This tutorial, which is a bit long, allowed us to familiarize ourselves with the Zigbee protocol, install an effective Coordinator/Controller enabling “long-distance” monitoring of an EDF Linky electricity meter (in France), and use the data collected in a plugin enabling “long-term” monitoring of electricity consumption, from several perspectives.
All that remains now is to regularly monitor consumption and costs, and generally take action on the main equipment and consumption habits in an attempt to be more efficient and reduce electricity use, and therefore the associated costs (and pollution). By also learning how the electrical installation is set up in detail, particularly in our case which devices are connected to which phase, we can consider automating immediate load shedding actions if necessary when we detect too great an imbalance between phases (which can damage certain equipment powered directly by three-phase current, particularly motors/compressors whose rotation could be unbalanced), and “fundamental” rebalancing actions by reassigning equipment from one phase to another (by rewiring).
Note that another plugin exists, Suivi Conso, available for €8 on the Jeedom Market, with even more features than the free Teleinfo plugin used here, but I find its configuration more complex and, in my case, its use not necessarily justified at this stage.
Appendices – Different methods used to feed data into the Teleinfo plugin
This appendix discusses my various attempts before successfully getting the Teleinfo plugin to work with data from Zlinky.
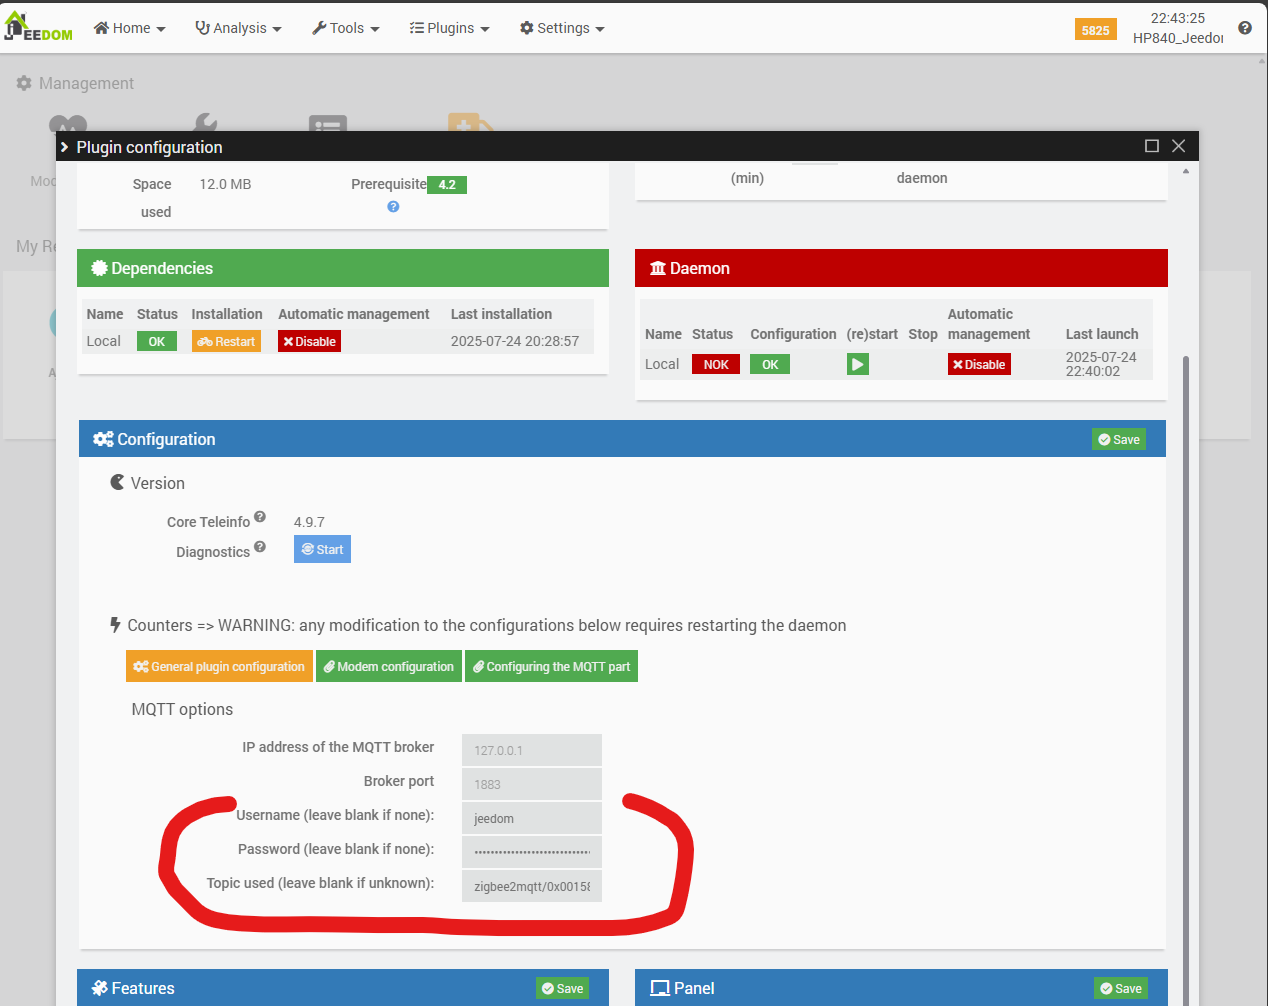
Appendix 1: Configuring the Teleinfo plugin with MQTT
A1.1. Basic configuration
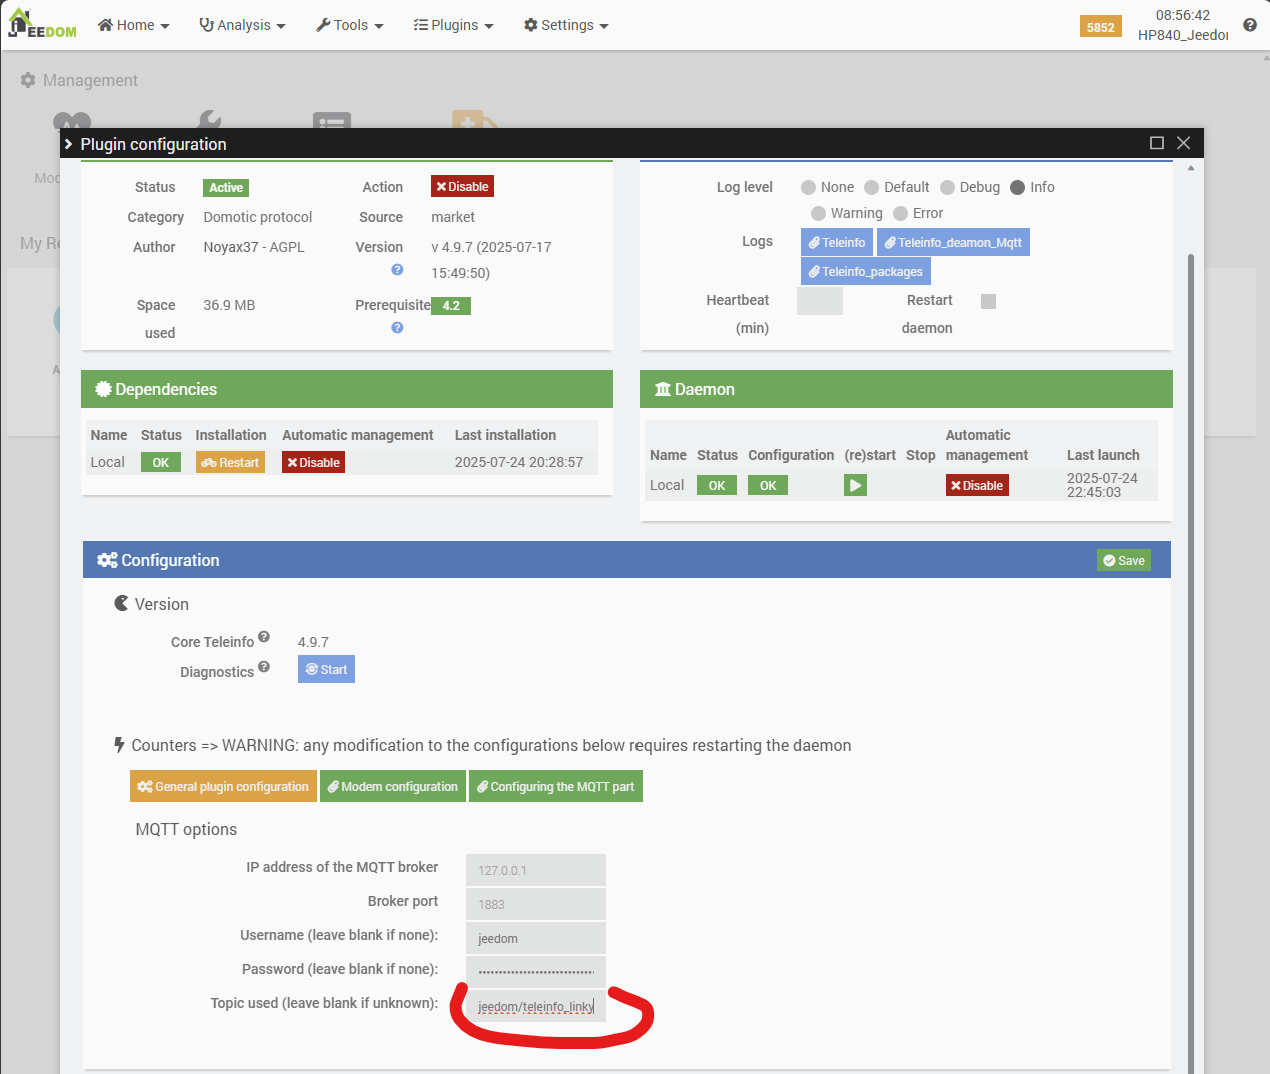
First configuration: uploading information via MQTT. First, we will indicate that we want to use MQTT via the “General plugin information” button, then configure MQTT via the “Configuring the MQTT part” button.
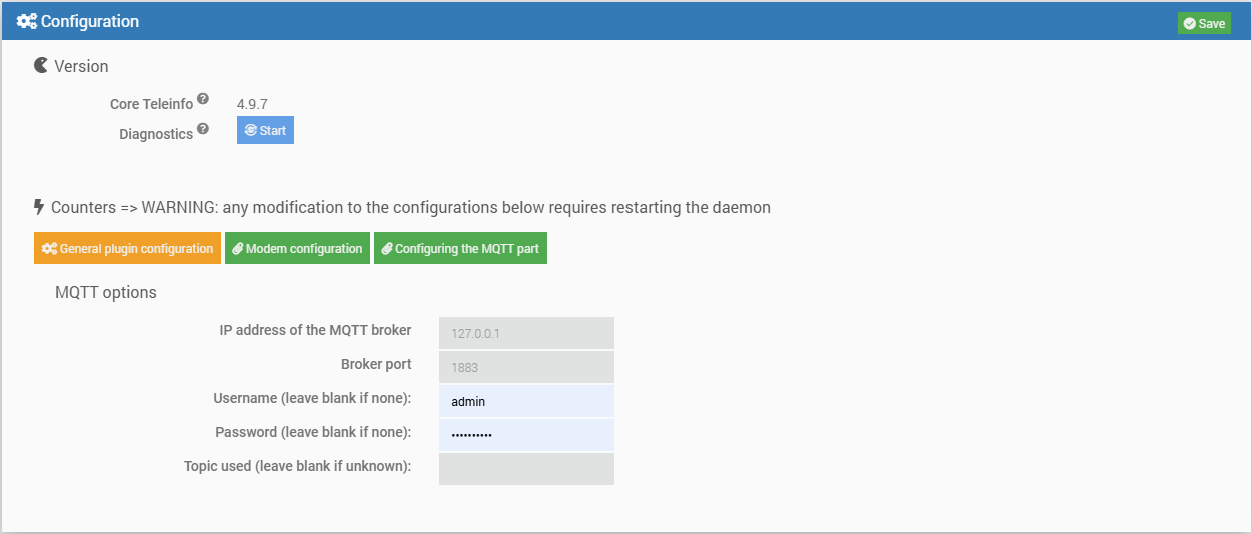
Configuring MQTT requires retrieving the ID and authentication details to access the broker, as well as the topic used by Zigbee2MQTT to publish messages from the Lixee Zlinky.
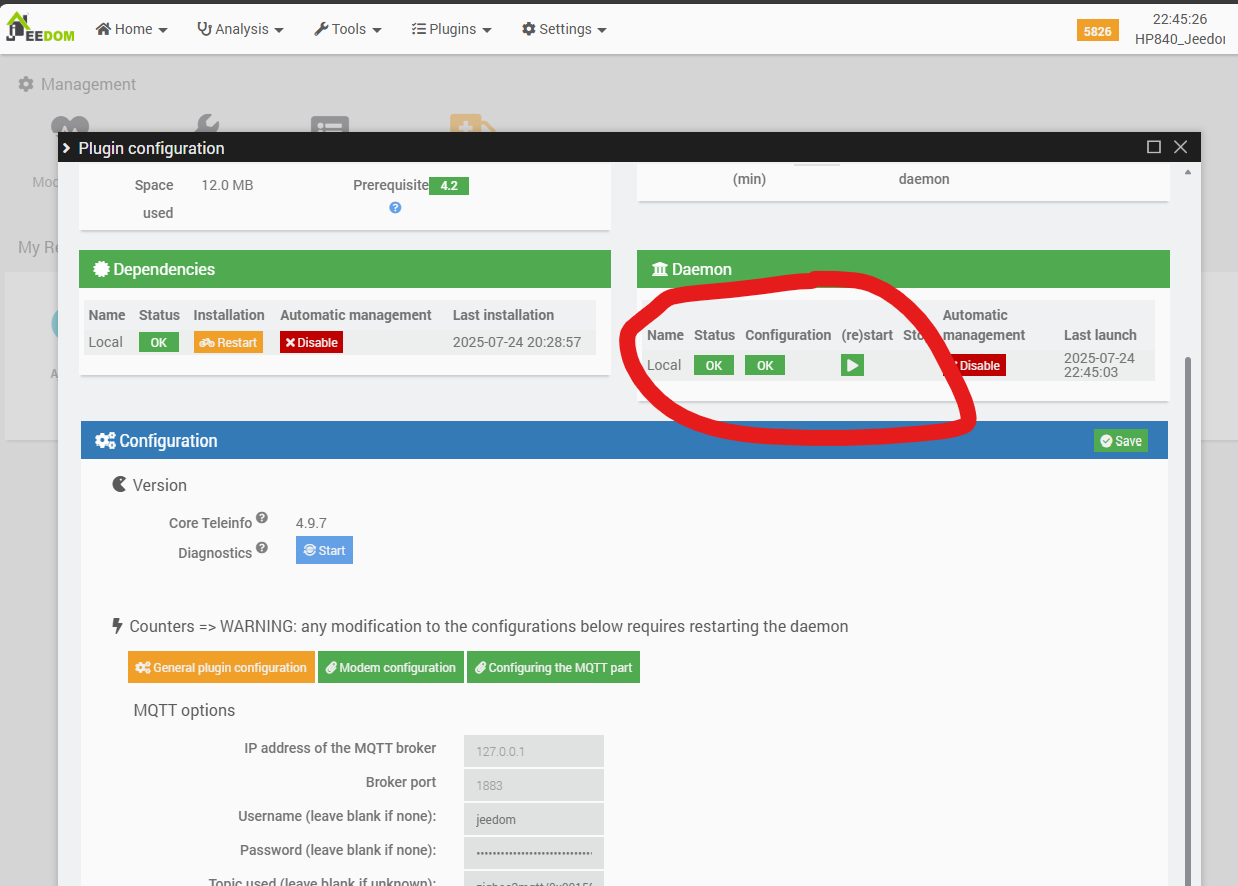
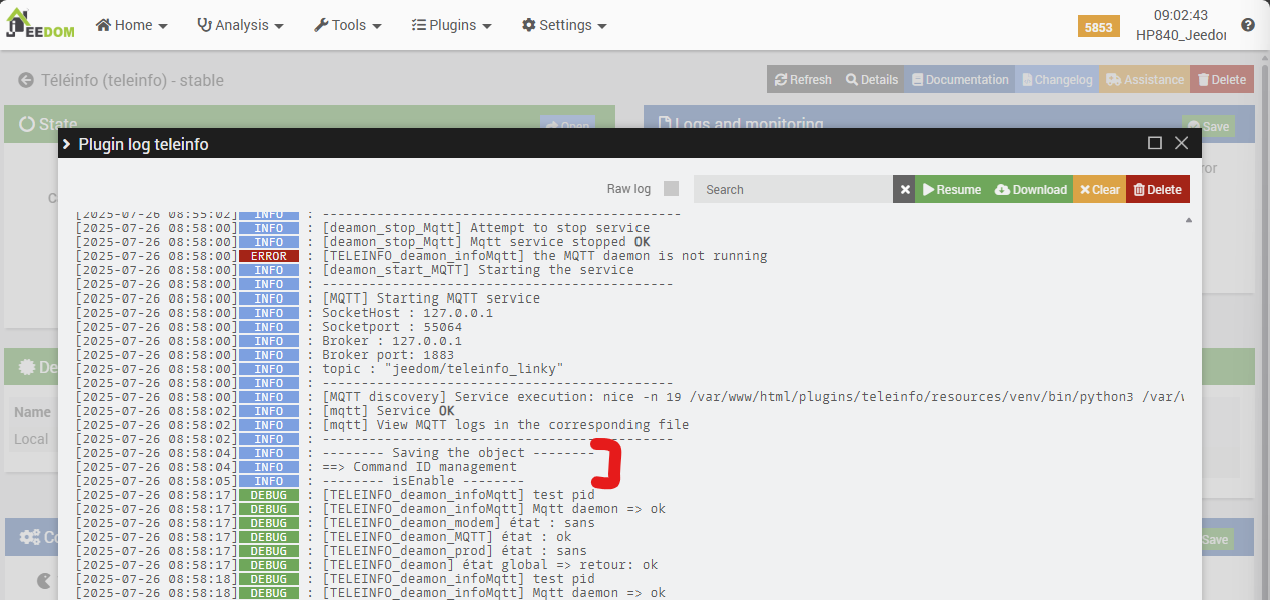
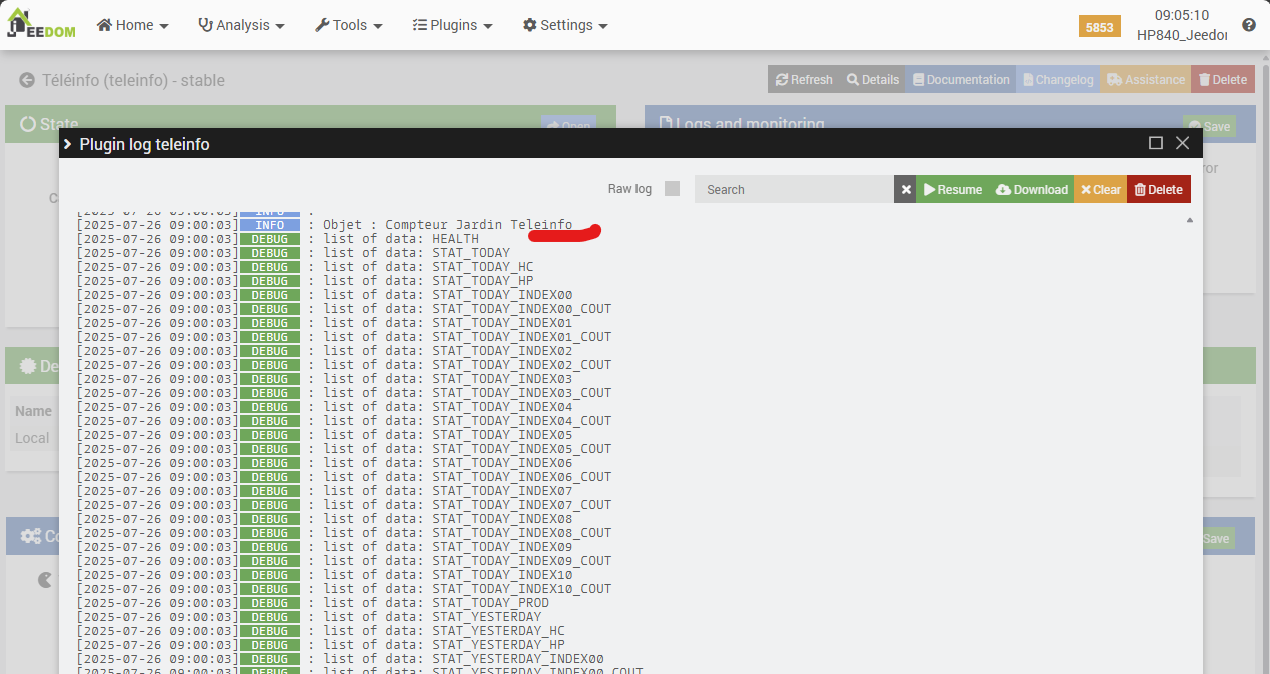
Now let’s try all of this: back to the Teleinfo plugin configuration.

Analysis: The problem is actually quite complex. We can see in the log captured above that the message transmitted on MQTT by the Zigbee2MQTT library does not contain the “standard” fields normally reported by ENEDIS’s TELEINFO protocol. We can also see this by consulting the logs directly on the Zigbee2MQTT library side.
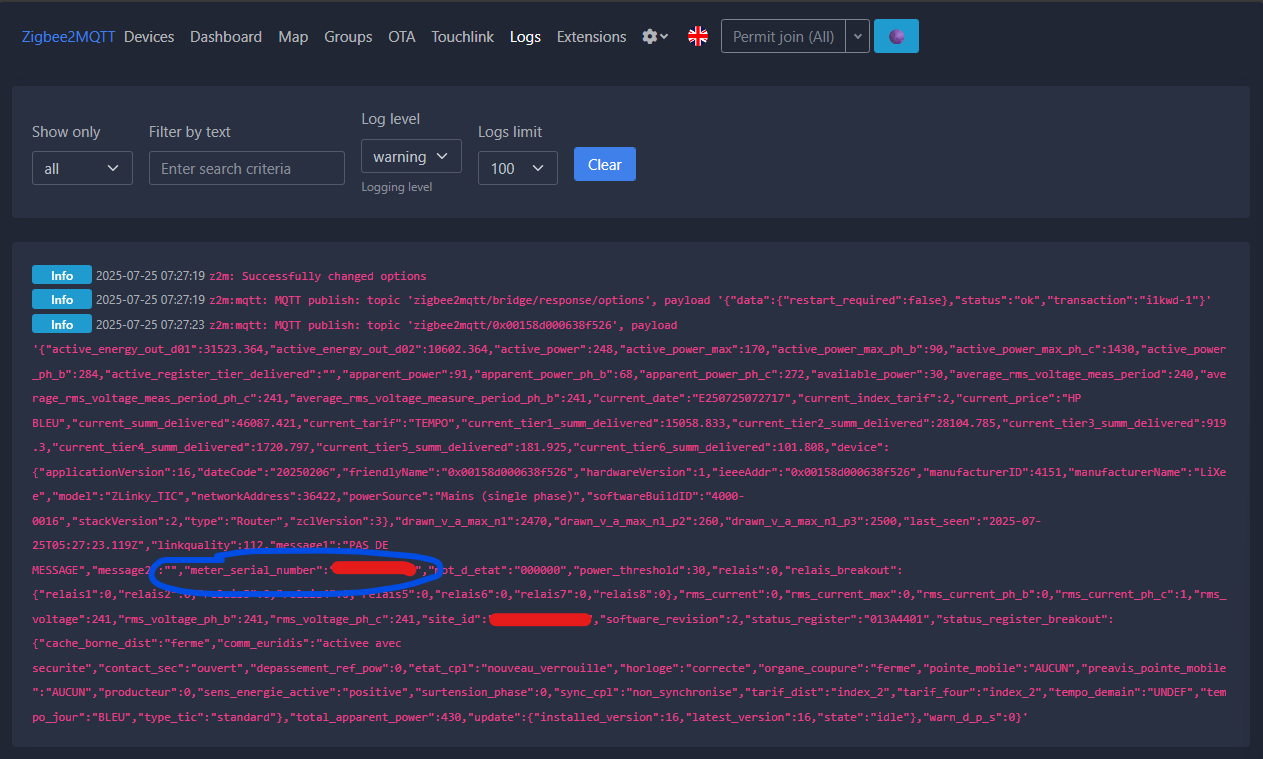
Where the TELEINFO plugin expects to retrieve an ADSC field to identify the serial number of a meter (which allows the plugin to automatically create new equipment in Jeedom), the published MQTT message will contain this serial number in the meter_serial_number field (source).
It is therefore understandable that:
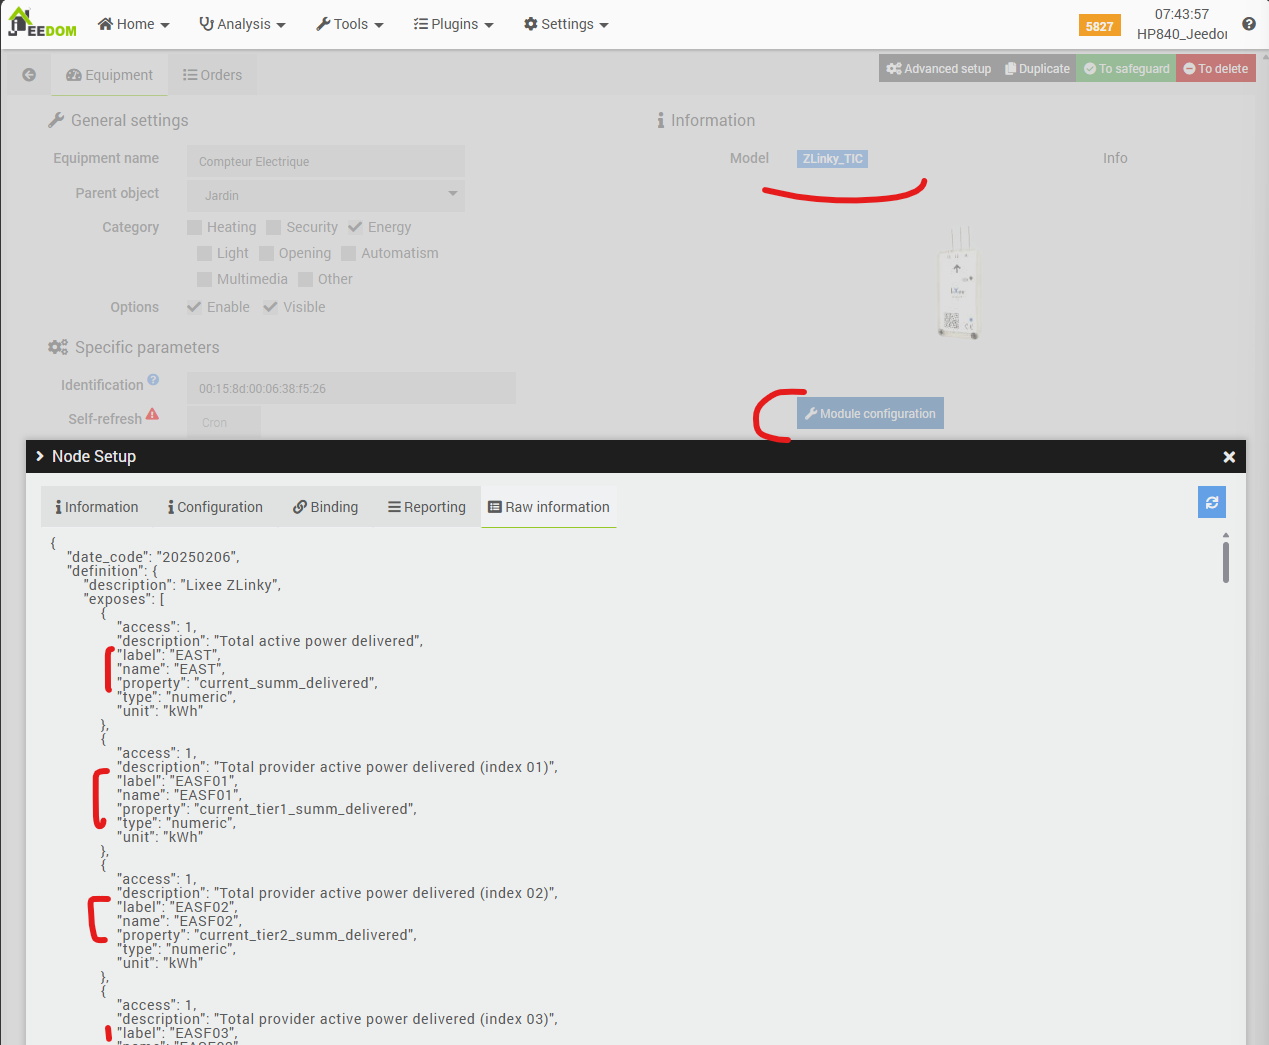
- The JeeZigbee/Z2M plugin from jeedom performs a transformation when it receives messages from ZLinky_TIC equipment, in order to create equipment containing information in an unknown standard. The details of the JeeZigbee device, under the “Raw Information” tab, show that this translation is likely to be performed via the “label” or “name” and “property” fields.
- The Jeedom Teleinfo plugin retrieves the expected data directly from the source (MQTT message), so it does not benefit from the transformation performed by the JeeZigbee plugin, and it clearly does not know how to perform this transformation itself (it would need to know how to do this for each type of TIC/Teleinfo modem).
We will therefore have to perform a new transformation ourselves, only on the fields that interest us, and to do this we will use Jeedom’s MQTT Manager module, which is already installed on our instance (as it is used by the ZWave JS plugin that we were already using before this article).
A1.2. Data transformation via MQTT Manager
We are basing our approach on a user post on the Jeedom forum, which has been very helpful. First, we add a device to Jeedom’s “MQTT Manager” plugin.
In this device, we will add a command that will “post” a message via the MQTT broker. This message is built with a JSON structure, in a format recognized by the teleinfo plugin, i.e., by associating the teleinfo chaps with the values already reported by the Zinky via the JeeZigbee/Z2M plugin. In the character string that we will post on MQTT, we will therefore retrieve information exposed by the Zlinky device reported via the other JeeZigbee/Z2M plugin.
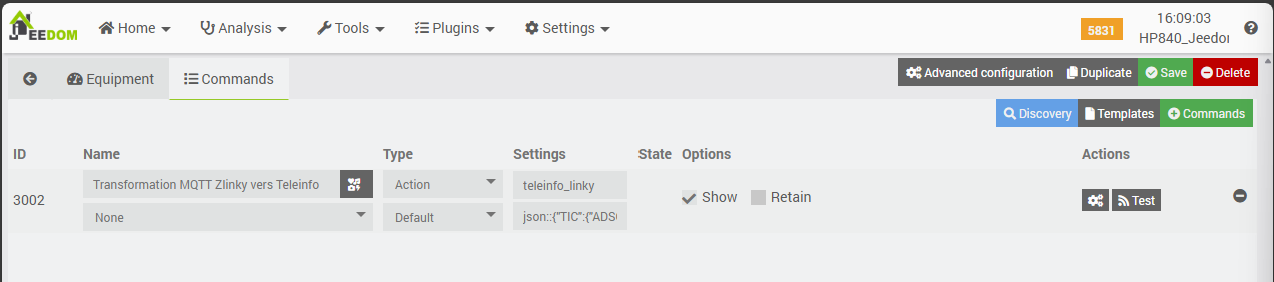
The associated chain is as follows (you can copy it as is, it works).
json::{
	"TIC":{
		"ADSC":"Compteur Jardin Teleinfo",
		"NGTF":"#[Jardin][Compteur Electrique][NGTF]#",
		"LTARF":"#[Jardin][Compteur Electrique][LTARF]#",
		"SINSTS":"#[Jardin][Compteur Electrique][SINSTS]#",
		"SINSTS1":"#[Jardin][Compteur Electrique][SINSTS1]#",
		"SINSTS2":"#[Jardin][Compteur Electrique][SINSTS2]#",
		"SINSTS3":"#[Jardin][Compteur Electrique][SINSTS3]#",
		"EASF01":"#[Jardin][Compteur Electrique][EASF01]#",
		"EASF02":"#[Jardin][Compteur Electrique][EASF02]#",
		"EASF03":"#[Jardin][Compteur Electrique][EASF03]#",
		"EASF04":"#[Jardin][Compteur Electrique][EASF04]#",
		"EASF05":"#[Jardin][Compteur Electrique][EASF05]#",
		"EASF06":"#[Jardin][Compteur Electrique][EASF06]#",
		"EAST":"#[Jardin][Compteur Electrique][EAST]#",
		"DATE":"#[Jardin][Compteur Electrique][DATE]#"
		}
	}
Here we see:
- That we “force” the name of the future device to “Compteur Jardin Teleinfo” via the ADSC field (because it will be created automatically by the Teleinfo plugin when the first message is received),
- The other fields (NGTF, SINSTS*, LTARF, EASF*, EAST, DATE) will be populated by calling up information from the “Electricity Meter” device exposed by the JeeZigbee/Z2M plugin.
- We need to convert the units: the EASF* and EAST data concerning the energy drawn from the supplier are reported in kWh, whereas the Teleinfo plugin expects them in Wh. We will therefore multiply them by 1000. To maintain accuracy, don’t forget to increase the precision of the kWh values in the Zigbee2MQTT library by 3 (Settings (Specific) tab).
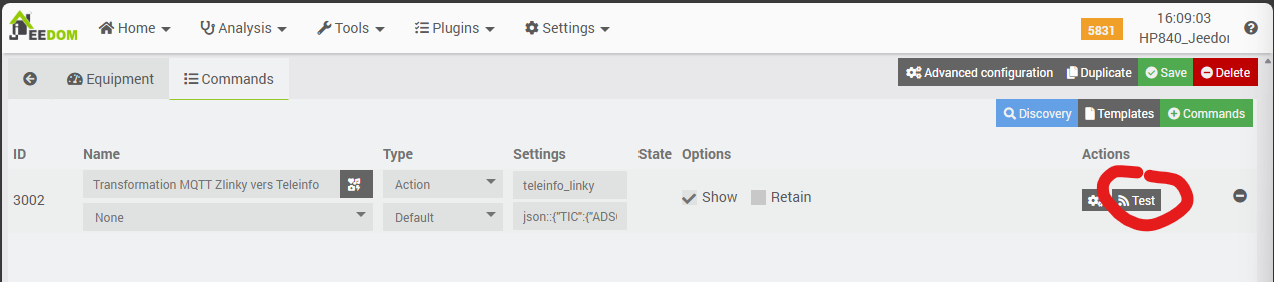
Let’s test the first message using the “Test” button.
Let’s check the MQTT Manager’s Mqtt2 logs, which we will have previously (and temporarily) switched to DEBUG mode.
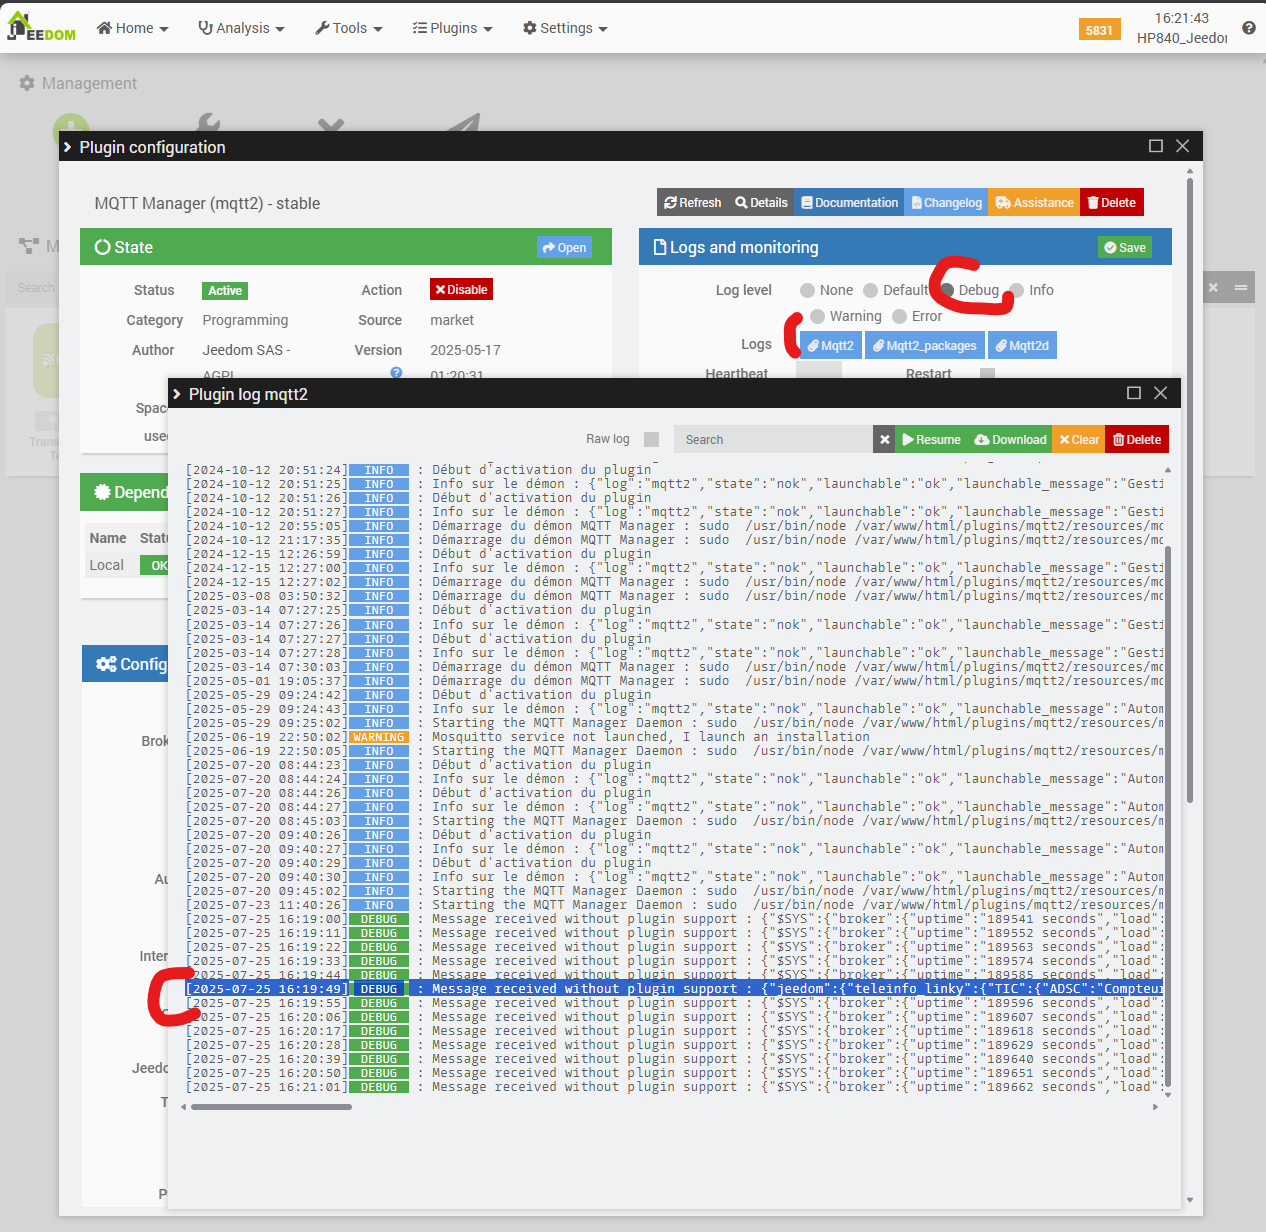
The complete line is:
[2025-07-25 16:19:49] DEBUG : Message received without plugin support : {"jeedom":{"teleinfo_linky":{"TIC":{"ADSC":"Compteur Jardin Teleinfo","NGTF":"TEMPO","SINSTS":495,"SINSTS1":197,"SINSTS2":8,"SINSTS3":284,"LTARF":"HP BLEU","EASF01":15058.833,"EASF02":28107.727,"EASF03":919.3,"EASF04":1720.797,"EASF05":181.925,"EASF06":101.808,"EAST":46090.406,"DATE":"E250725161935"}}}}
That sounds good, but now these messages need to be sent automatically each time one of these values is updated on the “original” device exposed by JeeZigbee/Z2M. To do this, we will create a scenario that will be triggered when one of the EASF* or EAST indexes is modified.
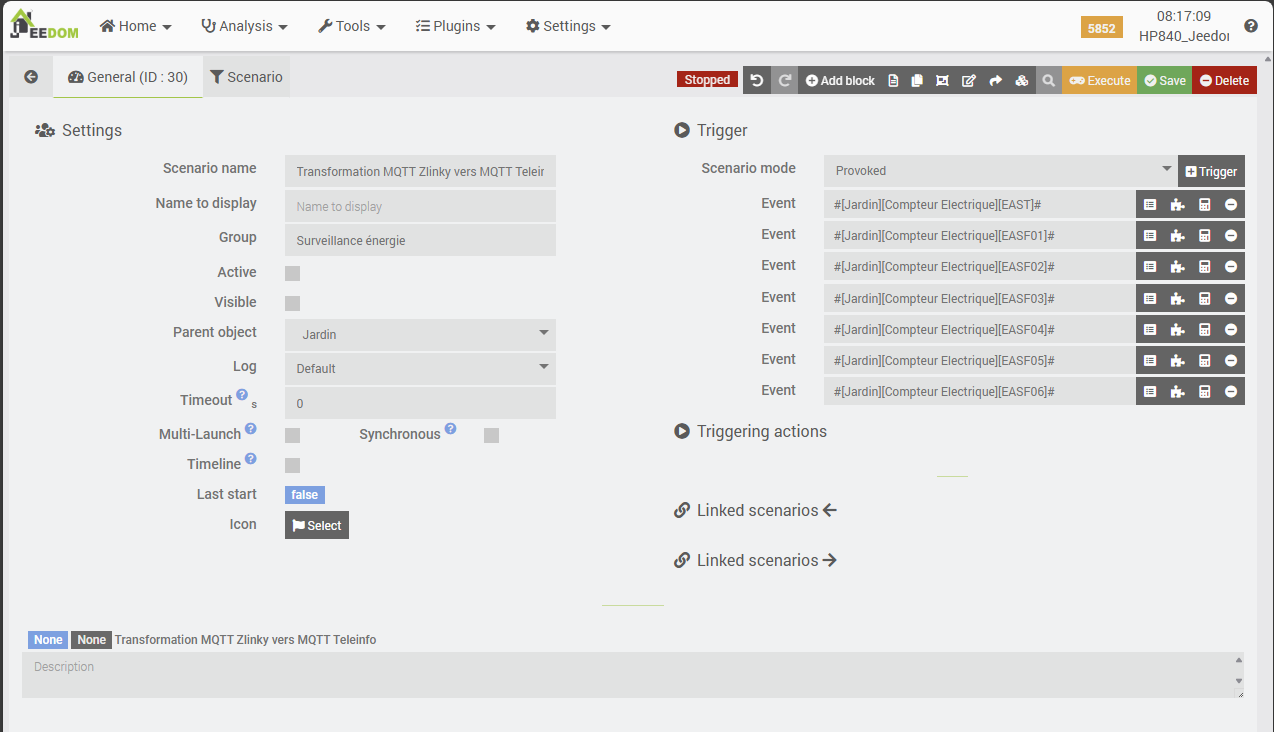

Don’t forget to save. Now we manually test the scenario using the small orange “Run” button at the top right, check its logs (as explained if you leave your mouse over the orange button, CTRL+click will save/run/open the log), and we will also check the mqtt2 log file in the MQTT Manager plugin. Unlike me, don’t forget to enable debug mode in MQTT Manager before your test (and disable it afterwards)!
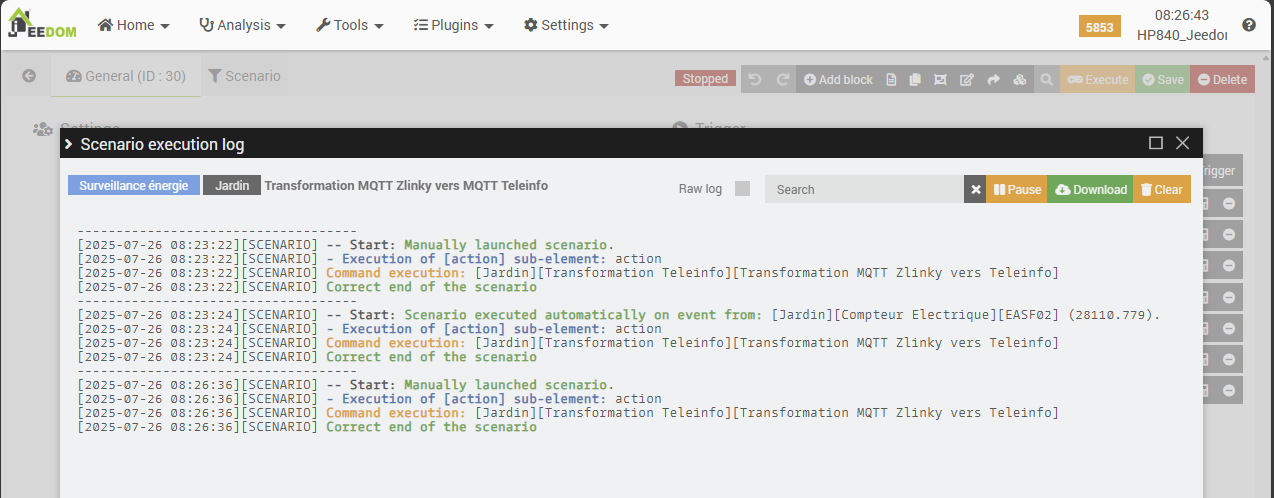
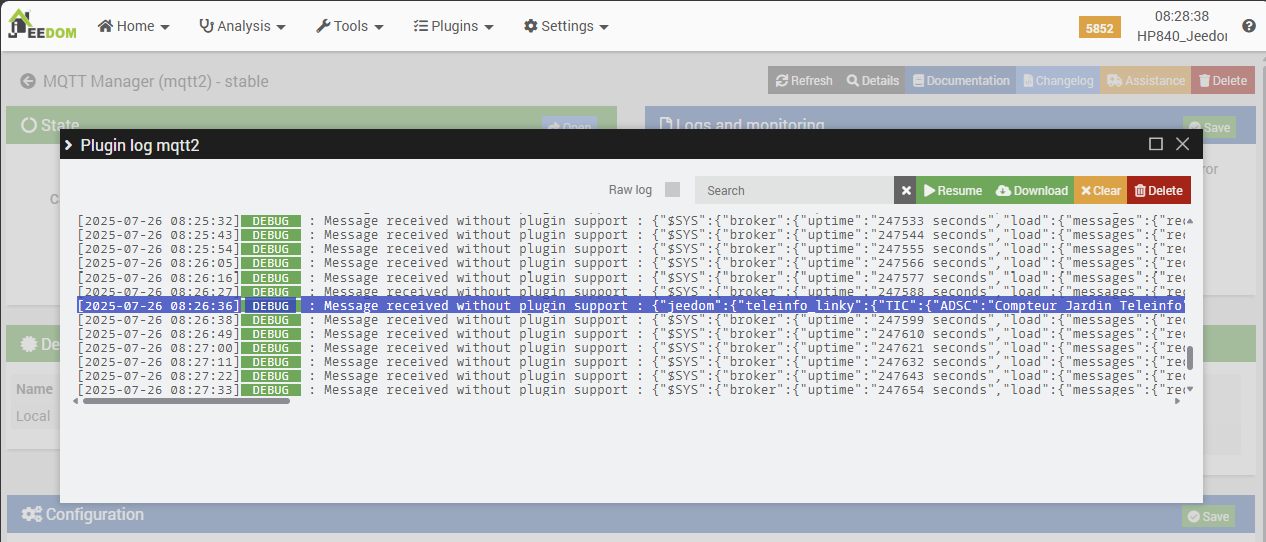
The complete line from the mqtt2 log file is shown below. It is interesting to note that the EASF02 field has the same value as we observed in our scenario log when it was launched automatically by the EASF2 trigger, rather than by our tests. So… It seems to be working well.
[2025-07-26 08:26:36] DEBUG : Message received without plugin support : {“jeedom”:{“teleinfo_linky”:{“TIC”:{“ADSC”:”Compteur Jardin Teleinfo”,”NGTF”:”TEMPO”,”SINSTS”:538,”SINSTS1″:89,”SINSTS2″:15,”SINSTS3″:433,”LTARF”:”HP BLEU”,”EASF01″:15077.176,“EASF02”:28110.779,”EASF03″:919.3,”EASF04″:1720.797,”EASF05″:181.925,”EASF06″:101.808,”EAST”:46111.766,”DATE”:”E250726082621″}}}}
Now that we have created our converter from MQTT “Zlinky” messages to “TELEINFO” messages, we can resume configuring the Teleinfo plugin.
A1.3. Plugin configuration: reading the “new format” MQTT
We can now resume configuring the Teleinfo plugin and ask it to scan the messages in the jeedom/teleinfo_linky topic, where our converter (the “MQTT Manager object” + automation scenario) posts its messages.
Now let’s check the equipment in the Teleinfo plugin dashboard. We should see a “Teleinfo Garden Meter” with all the new commands and information automatically created by the plugin (it will store this data to provide statistics on its dashboard).
We have made significant progress: the meter equipment has been created and its commands added by the plugin. We now need to configure its information sources more precisely in the “Equipment” tab to tell it which values correspond to the fields in the messages it reads in the MQTT queue.
And after a while, the first statistics start to appear on the dashboard… But it seems there is a (new) problem…
As you can see, the reported values are extremely low… The daily consumption is close to zero, which obviously isn’t normal. The fix is actually quite simple—and could have been spotted sooner by paying more attention to one thing: the units expected by the Teleinfo plugin vs. those sent by the Zlinky module. The plugin expects consumption data in Wh (Watt-hours), but the Zlinky reports values in kWh (kilowatt-hours). So, we just need to perform a basic conversion somewhere in our setup: multiply the values sent by Zlinky by 1,000 so they’re converted and sent in MQTT messages as Wh.
A1.4. Conversion of kWh consumption units to Wh
By conversion in JSON
The first method I tried was to modify the JSON used to send an MQTT message in Teleinfo format, in the equipment created in the MQTT Manager plugin.
json::{
	"TIC":{
		"ADSC":"Compteur Jardin Teleinfo",
		"NGTF":"#[Jardin][Compteur Electrique][NGTF]#",
		"LTARF":"#[Jardin][Compteur Electrique][LTARF]#",
		"SINSTS":"#[Jardin][Compteur Electrique][SINSTS]#",
		"SINSTS1":"#[Jardin][Compteur Electrique][SINSTS1]#",
		"SINSTS2":"#[Jardin][Compteur Electrique][SINSTS2]#",
		"SINSTS3":"#[Jardin][Compteur Electrique][SINSTS3]#",
		"EASF01":"#[Jardin][Compteur Electrique][EASF01]#*1000",
		"EASF02":"#[Jardin][Compteur Electrique][EASF02]#*1000",
		"EASF03":"#[Jardin][Compteur Electrique][EASF03]#*1000",
		"EASF04":"#[Jardin][Compteur Electrique][EASF04]#*1000",
		"EASF05":"#[Jardin][Compteur Electrique][EASF05]#*1000",
		"EASF06":"#[Jardin][Compteur Electrique][EASF06]#*1000",
		"EAST":"#[Jardin][Compteur Electrique][EAST]#*1000",
		"DATE":"#[Jardin][Compteur Electrique][DATE]#"
		}
	}
This does not work; the multiplication instruction is not interpreted and is sent as is in the MQTT message, which will therefore likely interfere with the Teleinfo plugin’s statistics calculations in the future. ==> Once we have a functional kinematic model, we will delete the equipment created by the Teleinfo plugin and create new equipment with a “clean” history of values.
By multiplying in each Teleinfo command
The second method used is to apply a conversion rule directly to each EASF* and EAST command from the Teleinfo plugin equipment.
At this stage, we can see that the values have been multiplied by 1000. Therefore, the unit is now Wh rather than the initial kWh. The problem now lies in the history of values already reported and stored in the Teleinfo plugin history.
So yes, we could reset the entire history in the database, but that’s not very industrial.
You could also uncheck the history for each command, save (which deletes the recorded history), then recheck the history. But that’s not very industrialized either.
Ideally, you want to be able to rely on sound data from the moment the equipment is created by the Teleinfo plugin, and that is the goal of the third solution.
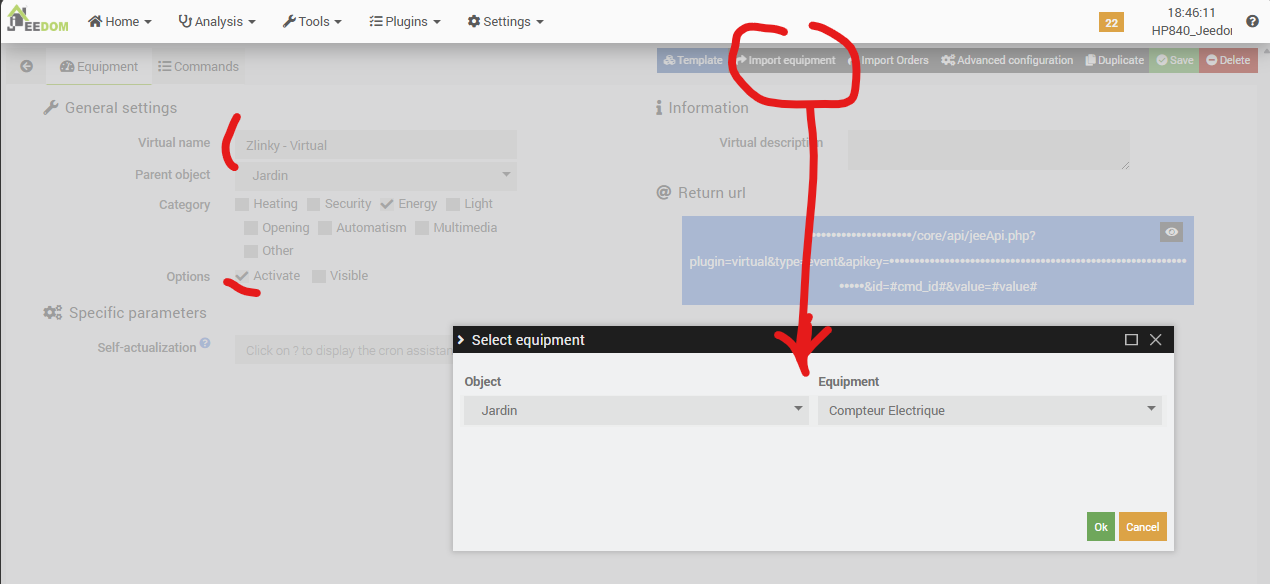
By virtual equipment
I am more confident that this solution will work: it involves creating new virtual equipment (using Jeedom’s “Virtual” plugin, which is free and supported by the Jeedom team).
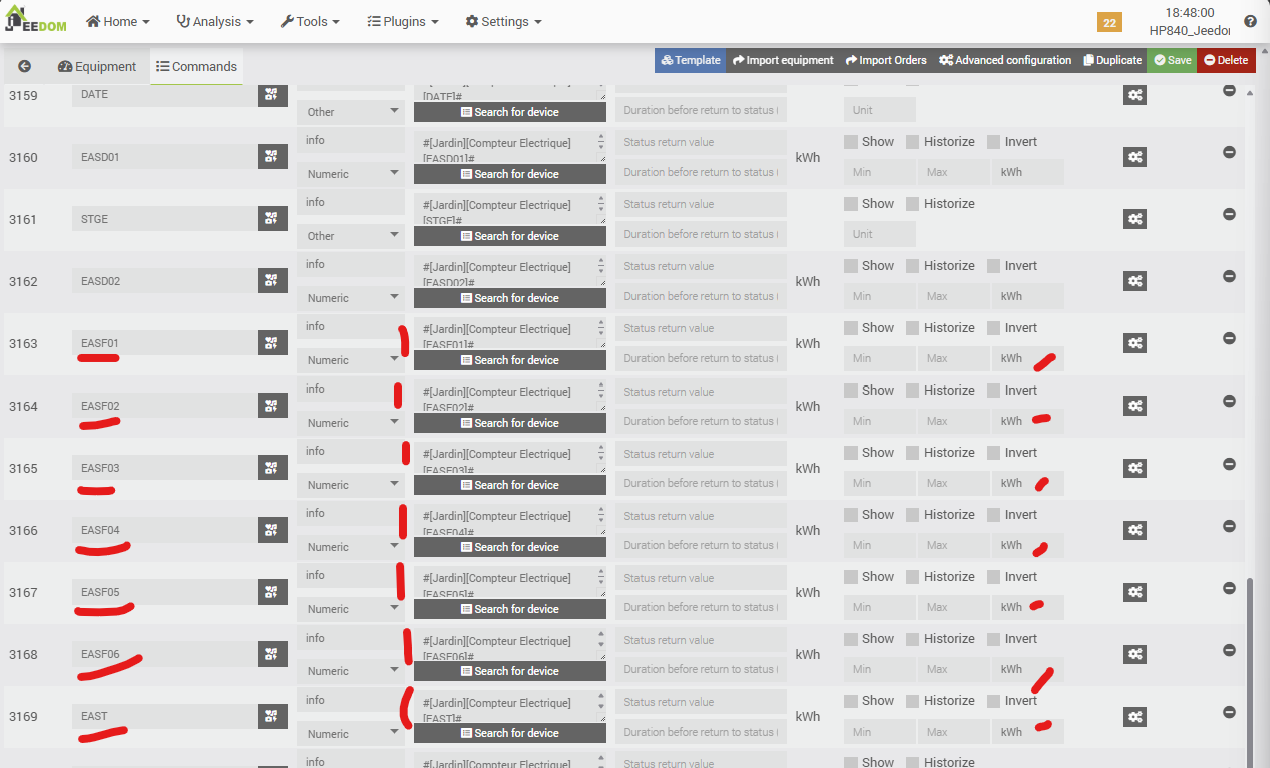
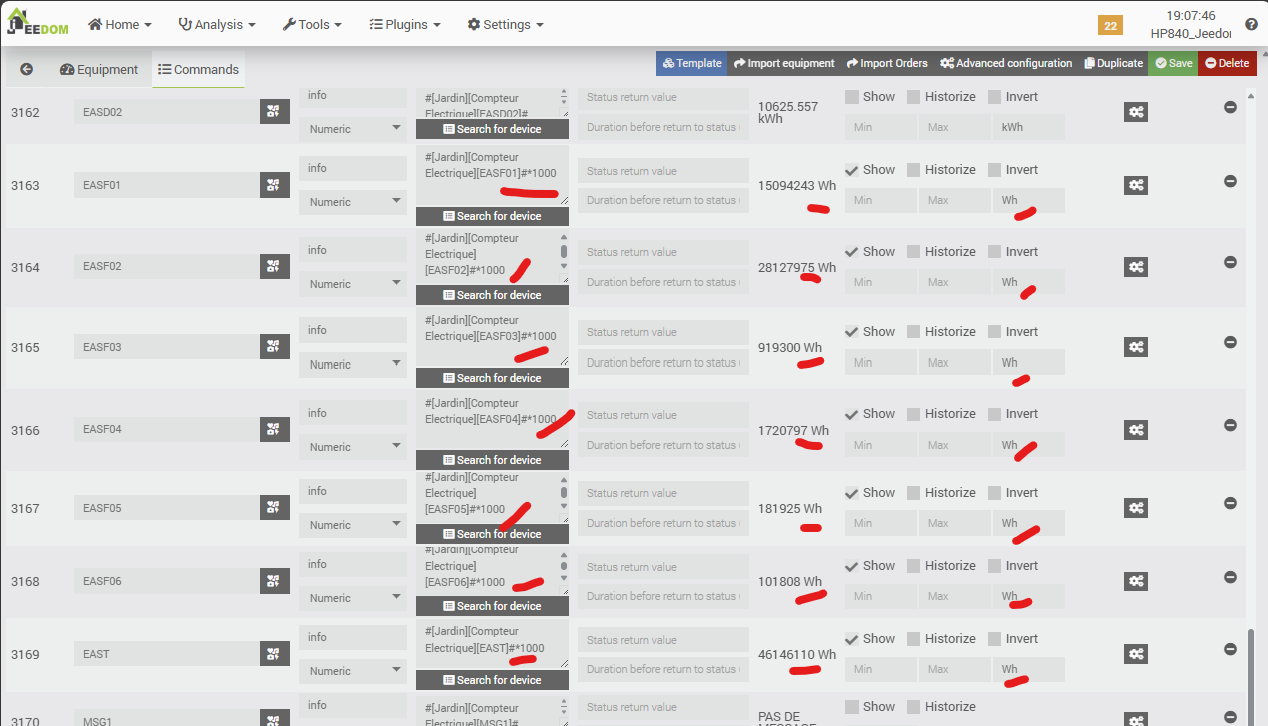
This virtual device will be a clone of the Zlinky device exposed by the JeeZigbee plugin, and will integrate a multiplication by 1000 of the consumption values. We will then modify the scenario for detecting changes in consumption values so that its triggers point to the virtual device, and we will modify the JSON configured in the MQTT Manager plugin device so that it retrieves the data to be used on the virtual device, multiplied by 1000. Once we have tested that the values are converted correctly and received correctly by the Teleinfo plugin, we will delete the current equipment, which has a poor data history due to our various attempts, and create new equipment with a different name to ensure that we are creating new equipment with no data.
Now we will modify the change detection scenario and its triggers to point to our new virtual equipment.
And we modify the JSON content in the “MQTT Manager” device that sends MQTT messages, to use the Wh values from the virtual device, rather than the kWh values from the “source” JeeZigbee device.
json::{
	"TIC":{
		"ADSC":"Compteur Jardin Teleinfo",
		"NGTF":"#[Jardin][Zlinky - Virtual][NGTF]#",
		"LTARF":"#[Jardin][Zlinky - Virtual][LTARF]#",
		"SINSTS":"#[Jardin][Zlinky - Virtual][SINSTS]#",
		"SINSTS1":"#[Jardin][Zlinky - Virtual][SINSTS1]#",
		"SINSTS2":"#[Jardin][Zlinky - Virtual][SINSTS2]#",
		"SINSTS3":"#[Jardin][Zlinky - Virtual][SINSTS3]#",
		"EASF01":"#[Jardin][Zlinky - Virtual][EASF01]#",
		"EASF02":"#[Jardin][Zlinky - Virtual][EASF02]#",
		"EASF03":"#[Jardin][Zlinky - Virtual][EASF03]#",
		"EASF04":"#[Jardin][Zlinky - Virtual][EASF04]#",
		"EASF05":"#[Jardin][Zlinky - Virtual][EASF05]#",
		"EASF06":"#[Jardin][Zlinky - Virtual][EASF06]#",
		"EAST":"#[Jardin][Zlinky - Virtual][EAST]#",
		"DATE":"#[Jardin][Zlinky - Virtual][DATE]#"
		}
	}
Now let’s check the “mqtt2d” logs in debug mode of the MQTT Manager plugin:
[2025-07-28 20:26:17] DEBUG : Publish message on topic : jeedom/teleinfo_linky => { "TIC":{ "ADSC":"Compteur Jardin Teleinfo", "NGTF":"TEMPO", "LTARF":"HC BLEU", "SINSTS":2598, "SINSTS1":2086, "SINSTS2":88, "SINSTS3":414, "EASF01":15094812, "EASF02":28129192, "EASF03":919300, "EASF04":1720797, "EASF05":181925, "EASF06":101808, "EAST":46147781, "DATE":"E250728222559" } } with options : {}Everything seems OK, the values are in Wh… Now, let’s deactivate the 2-minute scenario, change the name of the meter in the MQTT Manager equipment (the “ADSC” field), delete the existing meter in the Teleinfo plugin, and then reactivate the scenario. Normally, a new meter should be created automatically by the Teleinfo plugin, this time fed directly by values expressed in Wh.
After running this solution for a few hours, and in particular after waiting for the archiving and daily statistics calculation cron jobs to run, we can conclude that this solution works well. Order values are updated correctly and frequently, the level of detail in the history is good, and the dashboard provides a clear view of consumption and cost trends, broken down by pricing type according to the subscription plan.
This solution allows you to stay within the standard usage framework of the Teleinfo plugin, but I find it a little complicated, as it requires reformatting MQTT messages via additional equipment in MQTT Manager, having a trigger scenario, and having virtual equipment to convert kWh to Wh. I also regret that we have to call on the MQTT broker several times for what is ultimately the same purpose: transmitting the values reported by the Zlinky.
Appendix 2: Teleinfo commands fed by conversion scenario
This is actually the simplest solution, but it requires manually configuring the meter in the TELEINFO plugin, which is what I have been trying to avoid until now.
This solution was developed after interaction with the plugin developer on the Jeedom forum:
- Manually create a test counter: the plugin creates the history/statistics commands but not the “basic” commands used to track consumption indexes.
- Manually add 14 additional commands (ADSC, EAST, EASF*, LTARF, NGTF, SINSTS*) and their associated data fields.
- Association of teleinformation fields with controls,
- Creation of a scenario that triggers on EAST, EASF*, SINSTS* and feeds the 14 additional commands with a x1000 for EAST and EASF*.
This solution works and also provides a fully functional dashboard. Admittedly, it goes beyond the standard use of the TELEINFO plugin, as it does not obtain the data itself via a USB ICT modem or MQTT, and commands must be created and updated “manually.” However, it has the advantage of being relatively simple, does not require three different components, and works.
This is therefore the solution that is detailed “by default” earlier in the article and not here.
Discover more from SINECU.RE
Subscribe to get the latest posts sent to your email.